
Figure 4.
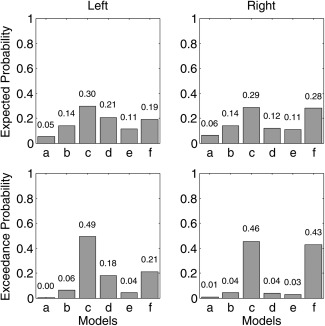
Expected and exceedance probabilities for the models tested in the DCM analysis. The left column depicts the results for left hemisphere while the right column depicts the results for the right hemisphere.
Official websites use .gov
A
.gov website belongs to an official
government organization in the United States.
Secure .gov websites use HTTPS
A lock (
) or https:// means you've safely
connected to the .gov website. Share sensitive
information only on official, secure websites.
Expected and exceedance probabilities for the models tested in the DCM analysis. The left column depicts the results for left hemisphere while the right column depicts the results for the right hemisphere.