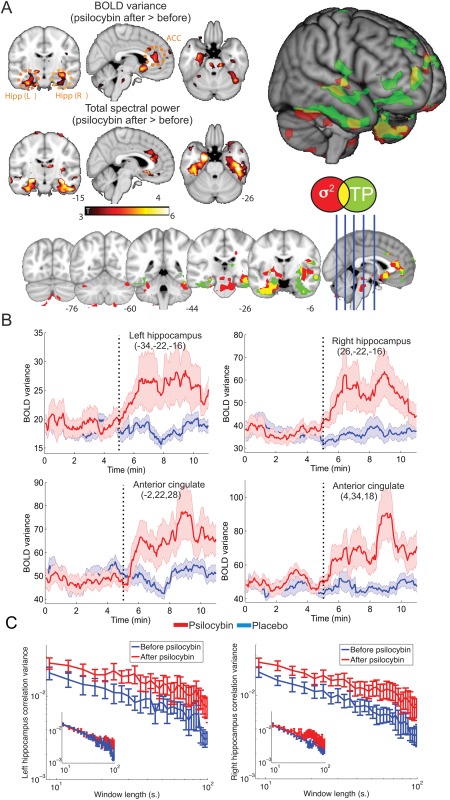
Figure 1.

Psilocybin infusion modifies the temporal variability of BOLD signal in a network comprising anterior cingulate cortex (ACC) and bilateral hippocampus. A) Maps of statistical significance for variance (σ 2) and total spectral power (TP) increases after psilocybin infusion. Results are shown overlaid separately into an anatomical MNI152 template, overlaid together and also rendered together into a three‐dimensional anatomical image. In all cases only clusters surviving a threshold of P < 0.05, Family Wise Error (FWE) cluster corrected (after passing an uncorrected threshold of P < 0.005) are shown. B) BOLD Variance time courses (obtained over a 1 min. sliding window) into the four regions of peak statistical significance defined in Table 1 for the psilocybin and the placebo infusion. C) Variance of the time course of intra‐hippocampal correlations (computed over a range of non‐overlapping window lengths) before and after psilocybin infusion. Results for placebo infusion are shown as insets (before and after in blue and red, respectively). [Color figure can be viewed in the online issue, which is available at http://wileyonlinelibrary.com.]
