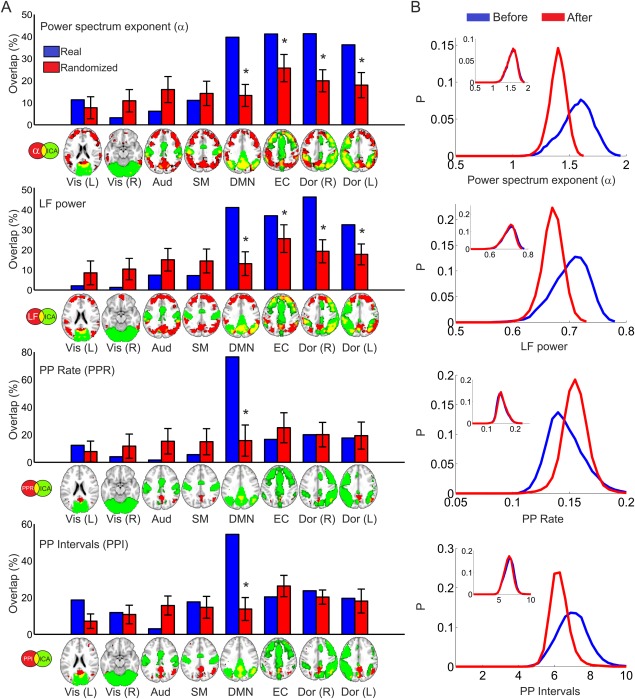
Figure 3.

BOLD spectral changes after psilocybin infusion are located in higher order brain networks and leave primary sensory areas unaffected. A) Overlap between statistical significance maps presented in Figure 2 and a group of well‐established cortical RSN (from Beckmann et al. [2005]) together with the average overlap obtained after 100 spatial randomizations preserving first order statistics (image phase shuffling). (*) indicates an empirical P value smaller than 0.05, Bonferroni corrected. This P value is defined as the ratio of instances in which the real maps yield a higher overlap than the randomized versions. B) Whole brain grey matter average probability distributions for α, LFP, PPR, and PPI, before and after psilocybin infusion. In the inset, the same distributions are shown before and after the placebo infusion. [Color figure can be viewed in the online issue, which is available at http://wileyonlinelibrary.com.]
