
Figure 4.
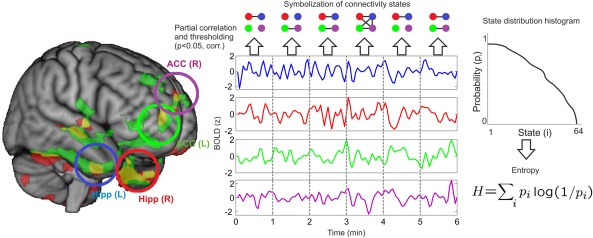
Entropy of the dynamical functional connectivity states. Illustration of the procedure to estimate the temporal evolution of the collective states (i.e. all possible 64 motifs) in the network of regions associated with increased temporal variability (bilateral hippocampi and ACC). After selecting the four regions of interest demonstrating enhanced variability after psilocybin infusion (left and right hippocampus, left and right ACC), the partial correlation between all variables is computed (including also the mean head displacement time series as a partial regressor). After thresholding (with P < 0.05, corrected) a series of up to 64 discrete connectivity states are obtained from which the probability distribution can be computed. Finally, from this information, histograms of states (provided here as an illustration) and their corresponding Shannon's entropy (H) can be computed. [Color figure can be viewed in the online issue, which is available at http://wileyonlinelibrary.com.]