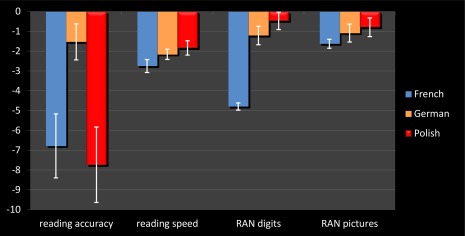
Figure 1.

Behavioral performance in reading accuracy, reading speed, and naming speed in the SRD sample. Raw data were transformed into z‐scores relative to the distribution of the group of normal controls of the same grade and same country. Error bars represent standard deviation. [Color figure can be viewed in the online issue, which is available at http://wileyonlinelibrary.com.]
