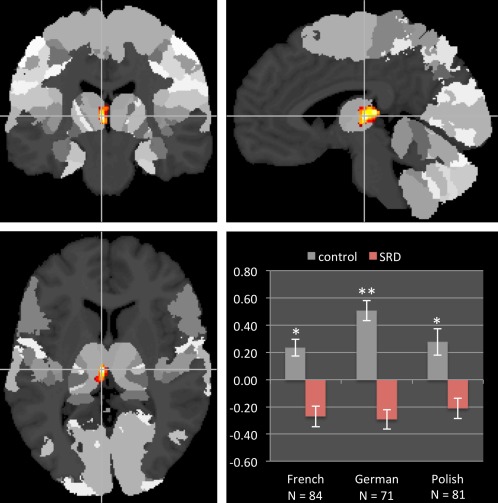
Figure 2.

Group differences in gray matter volume overlaid on the Julich Anatomy Atlas. The region in the left thalamus shown in red–yellow exhibited reduced volume in the dyslexic group (prefrontal—54.6 % probability, temporal—10.5 % probability). Mean gray matter volume extracted from this cluster (displayed in z‐scores) shows consistent group difference across three languages. Error bars represent SEM. **P < 0.001; *P < 0.05. [Color figure can be viewed in the online issue, which is available at http://wileyonlinelibrary.com.]
