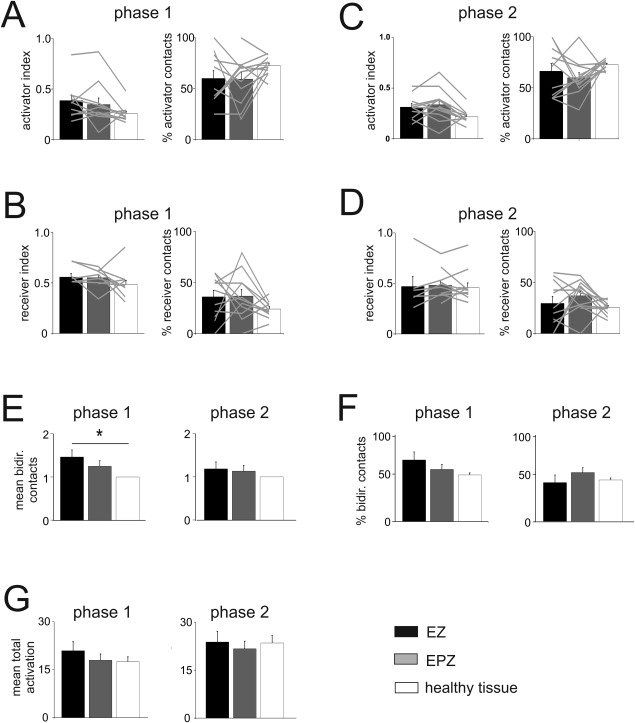
Figure 4.

Distribution of activating, receiving, and bidirectional connections. A–D: Average values of AR‐index for mainly activator or receiver contacts and the percentage of activator and receiver contacts for phase 1 (A and B) and phase 2 (C and D) in EZ (black columns), EPZ (gray columns), and healthy tissue (white columns), calculated in 12 patients. Values from each patient are illustrated by light gray lines. E: Quantification of the average number of bidirectional connections in EZ and EPZ normalized to the mean number of bidirectional connection of the contacts in healthy tissue calculated for phase 1 (left) and phase 2 (right panel). F: Percentage of bidirectional connections in EZ and EPZ calculated for phase 1 (left) and phase 2 (right panel). The value of normalized bidirectionality and percentage beside the absolute number of mean bidirectional contacts from each patient are reported in Supporting Information Figure 1. G: The total activation is the summation of activated and activating contacts for each stimulated contact, minus the number of bidirectional connections, averaged with respect to the pathological and healthy regions. The absence of any statistical significance in this parameter let us reject the hypothesis of a bias on the activator or receptor behavior of each contact due to a higher number of activated/activating contacts.
