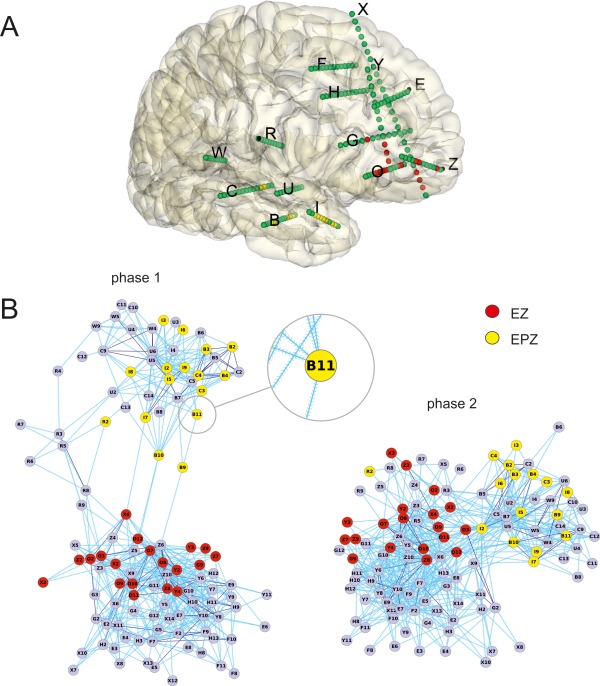
Figure 5.

A: Schema of the recording contacts inside the brain of patient 9; in red the contacts in the EZ and in yellow the ones in the EPZ. B: Two‐dimensional connectivity maps based on the stimulated/activated contacts. Map of contact connectivity during phases 1 and 2 in patient 9, based on the analysis of averaged SPES‐evoked responses. Separation between contacts was optimized using a force‐directed layout [Fruchterman and Reingold, 1991]. Connections (light blue) with marked directions (see enlargement of B11 contact) originate from stimulated contacts and end on supra‐threshold activated contacts. Purple lines represent bidirectional relationships between couples of contacts. EZ contacts (reported in red) are clustered separately from the EPZ contacts (in yellow) in this patient. Bridging links connect the two main groups of contacts both maps. The two main groups of contacts of phase 1 and 2 maps are all included in temporal lobe (upper and right groups in phase 1 and 2, respectively) and in frontal lobe (lower and right groups in phase 1 and 2, respectively). For phase 1, contacts interposed between the two groups represented intermediate structures between the two lobes: contacts R2 to R9 were located in the central operculum and contacts B9‐B11 in the medium temporal gyrus.
