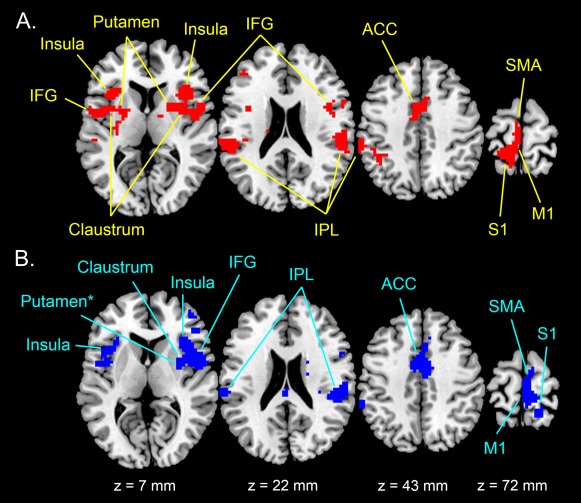
Figure 1.

Full‐group activation maps during (A) right (R100 > R30 contrast) and (B) left (L100 > L30 contrast) vibration stimulation rendered on standard T1 template. Maps are thresholded at P < 0.001 uncorrected (t > 3.79) with an extent threshold k = 10 voxels and are inclusively masked using either R100 > REST or L100 > REST (P < 0.05 uncorrected). Clusters of activity (P < 0.05, FWE correction) are indicated with arrows. IFG: inferior frontal gyrus; IPL: inferior parietal lobule; ACC: anterior cingulate cortex; SMA: supplementary motor area; M1: primary motor cortex; S1: primary somatosensory cortex. Note that right putamen during left stimulation did not survive clusterwise FWE correction, as indicated by the asterisk. [Color figure can be viewed in the online issue, which is available at http://wileyonlinelibrary.com.]
