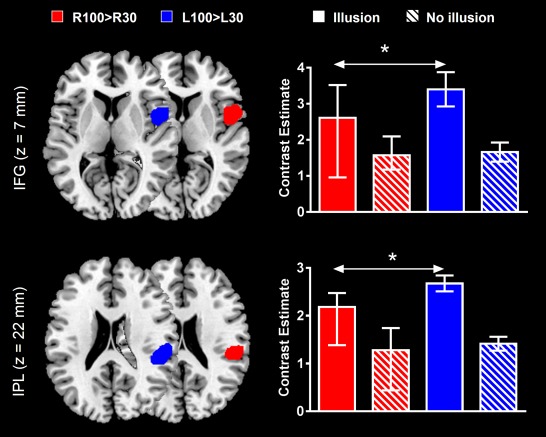
Figure 3.

L100 > L30‐ and R100 > R30‐evoked activations in right inferior frontal gyrus (IFG) and right inferior parietal lobule (IPL) regions of interest (ROIs). For each subsample of subjects (i.e., subjects who reported having and not having illusory movements), differences between left‐ and right‐evoked activations are indicated by the arrows (*P <0.05). The clusters reported on the brain slices delineate the overall areas that contained the leave one subject out (LOSO) ROIs that were used to extract contrast estimates. Data in barplots are reported as median ± IQR. [Color figure can be viewed in the online issue, which is available at http://wileyonlinelibrary.com.]
