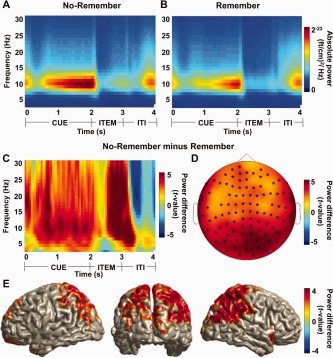
Figure 3.

The posterior alpha power (10 Hz) for the “No‐Remember” cue compared to the “Remember” cue. Time‐frequency representations for the “No‐Remember” (A) and the “Remember” (B) cue conditions averaged over 20 posterior sensors. (C) A time‐frequency representation of power calculated for 20 posterior sensors revealed a strong increase in the alpha band when comparing the “No‐Remember” to the “Remember” cue (normalized by the mean of the two conditions). This effect was pronounced in the cue interval (0–2 s), but also during item presentation and beyond (P < 0.05). (D) Topographical distribution of alpha power increases during the cue interval (10 Hz; 1–2 s) was found in a huge cluster including most sensors (cluster‐level permutation, P = 0.0002). (E) Source reconstruction using a beamforming technique of the “No‐Remember” versus “Remember” effect (10 Hz; 1–2 s). The alpha power increase was localized in posterior parietal regions (cluster‐level permutation, P < 0.05). [Color figure can be viewed in the online issue, which is available at http://wileyonlinelibrary.com.]
