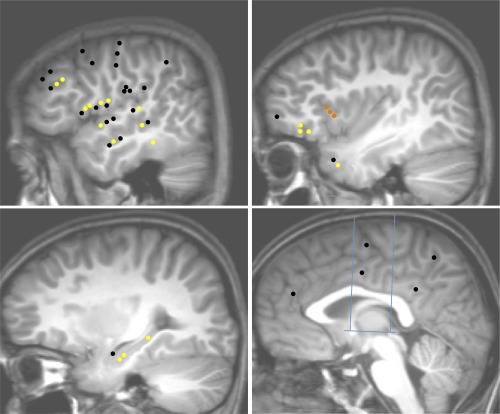
Figure 4.

ASG connectivity pattern: Upper left: Temporal neocortex, dorso‐lateral frontal cortex, fronto‐parietal operculum, temporo‐parietal junction; Upper right: Insula, temporal pole, frontal pole and the fronto‐orbital cortex; Lower left: mesio‐temporal structures; Lower right: medial frontal, parietal, and occipital cortices, cingulate gyrus. Blue lines in the lower right figure indicate CA‐CP axis and the orthogonal VCA and VCP axis. Yellow dots: connections demonstrating significant CCEPs; Black dots: connections without significant CCEP; Orange dots: ASG electrodes.
