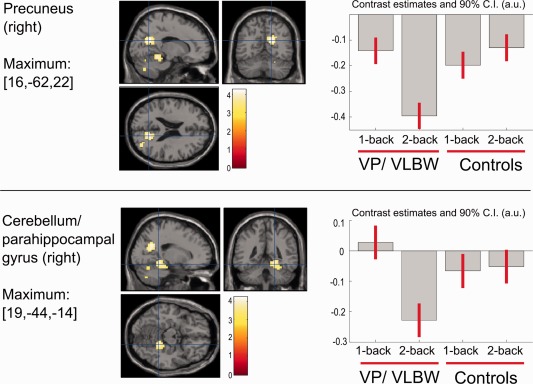
Figure 2.

Between‐group differences for the 2‐back versus 1‐back contrast, showing significantly enhanced deactivations for preterm‐born adults during the 2‐back task. Shown are brain regions with significant group differences in the two‐sample t‐test while additionally controlling for nuisance variables (Scanner, Full Scale IQ and response speed). Contrast estimate plots showing relative activation (positive values) or deactivation (negative values) against common 0‐back control task for the local cluster maxima. In both regions, group differences were characterized by stronger deactivations in the VP/ VLBW group during the 2‐back condition. Upper panel: right ventral precuneus cluster, with peak maximum at MNI coordinate [16, −62, 22]. Lower panel: right cerebellar and parahippocampal cluster, peak maximum at MNI coordinate [19, −44, −14]. Statistical maps are presented with a voxel‐wise height threshold of P < 0.001 uncorrected, and cluster size k = 10, for display purposes. Crosshairs indicate the maxima of the two clusters surviving P < 0.05 FWE correction (cluster‐wise). A.u. – Arbitrary units.
