
Figure 3.
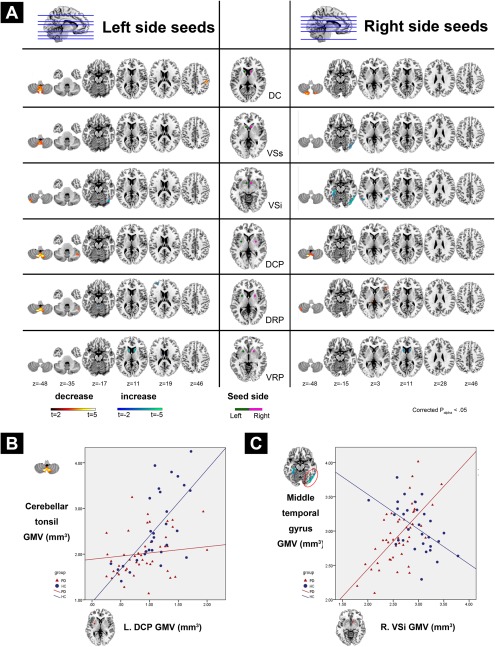
Group differences in SC pattern for each striatal subdivisions between healthy controls and patients with PD. (A) The middle column shows the seed ROIs used in this study. Statistical parametric maps show brain regions in which GM volume covaried with the corresponding bilateral seed ROIs differently between groups. (B) Areas showing decreased SC in patients with PD compared to HC were presented in “hot” color (i.e., steeper positive correlation slope between regional GM volume and corresponding striatal subdivisions in HC compared to PD patients). (C) Areas showing increased SC in patients with PD compared to HC were presented in “cold” color (i.e., steeper positive correlation slope between regional GM volume and corresponding striatal subdivisions in PD patients compared to HC). The detailed slope value for each group is listed in Table 3. The statistical criteria for between group SC analyses were set at FWE corrected P alpha < 0.05 (corrected for multiple comparisons by means of a Monte Carlo simulation). Results were overlaid on a MNI standard space T1 template. Abbreviations: DC, dorsal caudate; DCP, dorsal caudal putamen; DRP, dorsal rostral putamen; FWE, family‐wise error; HC, healthy control; MNI, Montreal Neurological Institute; PD, Parkinson's disease; ROIs, region of interests; SC, structural covariance; VSi, inferior ventral striatum; VSs, superior ventral striatum; VRP, ventral rostral putamen.