
Figure 1.
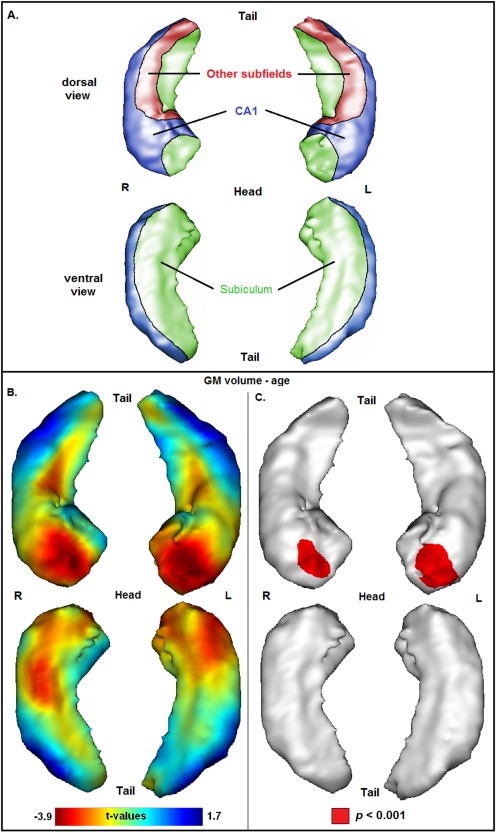
(A) Schematized representation of hippocampal subfields based on a 3D view of the hippocampus (CA1 = blue, subiculum = green, other subfields = red), according to an illustration provided in a previous publication [Chételat et al., 2008]. (B) Projection of the association between age and GM volume onto the 3D hippocampal mesh (SPM t‐map; with total intracranial volume as covariate). (C) Illustration of corresponding significances (in red: P < 0.001, uncorrected for multiple comparisons).