
Figure 1.
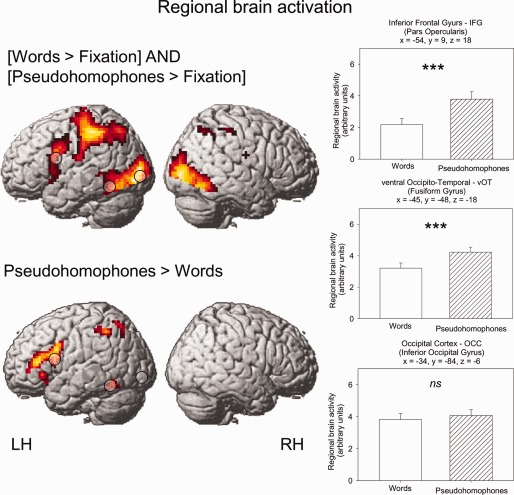
Top: Regions showing activation for the conjunction words > fixation and pseudohomophones > fixation. Bottom: Regions showing increased activation for pseudohomophones > words. Results are shown at a voxelwise threshold of P < 0.001 and minimum extent of 20 voxels. Bar‐charts report brain activity estimates (M; SEM) for regions of interests. [Color figure can be viewed in the online issue, which is available at http://wileyonlinelibrary.com]