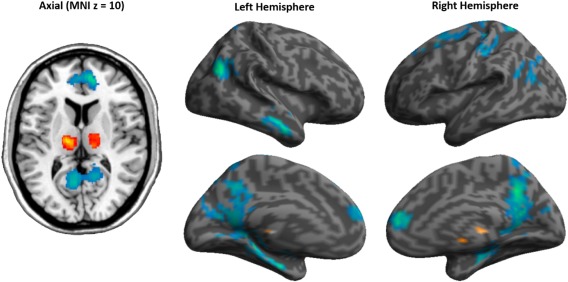
Figure 1.

Thalamocortical FC differences between heroin and placebo treatment in heroin‐dependent patients. Red indicates increased FC by heroin and blue indicates reduced FC relative to the placebo treatment. [Color figure can be viewed in the online issue, which is available at http://wileyonlinelibrary.com.]
