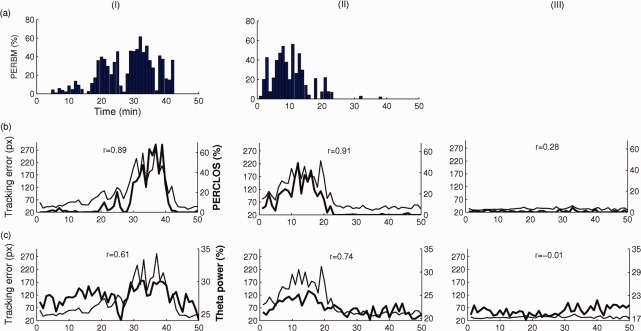
Figure 3.

Per minute estimates of percentage time spent in microsleeps (PERBM), percentage time with greater than 80% eye closure (PERCLOS), relative theta power at Pz, and tracking error in three representative participants. The top panel depicts PERBM in the participant with highest number (190) of microsleeps (I) and a participant with a moderate number (77) of microsleeps (II). The middle panel depicts tracking error (thin line) and PERCLOS (thick line) in the same two participants plus a participant with no microsleeps (III). The bottom panel depicts tracking error (thin line) and relative theta power (thick line) in the same participants. Pearson correlations (r) between time‐courses are displayed within each panel. [Color figure can be viewed in the online issue, which is available at http://wileyonlinelibrary.com.]
