
Figure 4.
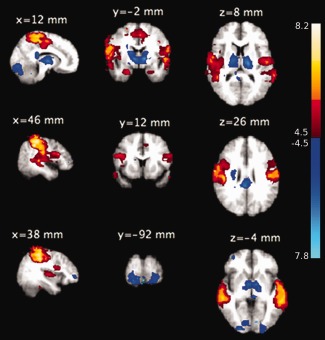
Group‐level significant (Z > 4.5, P < 0.01, family‐wise‐error corrected) pattern of activation (Red‐yellow) and deactivation (blue‐light blue) during microsleeps are shown overlaid on average structural slices. The group‐level pattern was obtained from the 14 participants with frequent microsleeps. The slices are presented in radiological convention and labeled with MNI coordinates. [Color figure can be viewed in the online issue, which is available at http://wileyonlinelibrary.com.]