
Figure 5.
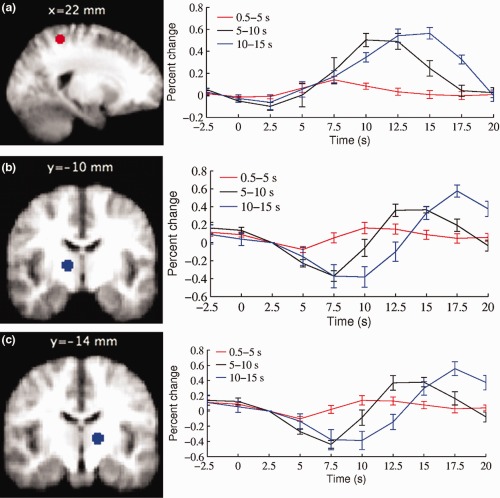
The BOLD signal modulated by duration in the (a) right superior parietal cortex (MNI coordinates (mm): 22, −44, 58), (b) right thalamus (MNI coordinates (mm): 14, −10, 4), and (c) left thalamus (−14, −14, 4). Average BOLD signal time‐course for three different duration microsleeps bins (0.5–5 s, 5–10 s, and 10–15 s) are shown. The time‐courses were obtained from the eight participants who had microsleeps in all three duration bins. The vertical bars represent the standard error of the mean across subjects (N = 8). The onset of microsleeps is at time zero. Note that both activation and deactivation signals mirror the duration of microsleeps. [Color figure can be viewed in the online issue, which is available at http://wileyonlinelibrary.com.]