
Figure 7.
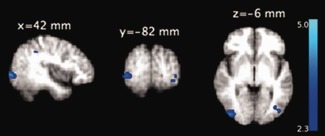
Group‐level statistical maps showing negative correlation (P < 0.01, cluster‐extent of 50 voxels) between BOLD and spontaneous alpha activity (average of O1, O2, Oz) in individuals with frequent microsleeps. The group‐level pattern was obtained from the 10 participants with frequent microsleeps and electrode impedance <15 kΩ. The axial slices are presented in radiological convention and labeled with MNI coordinates. [Color figure can be viewed in the online issue, which is available at http://wileyonlinelibrary.com.]