
Figure 3.
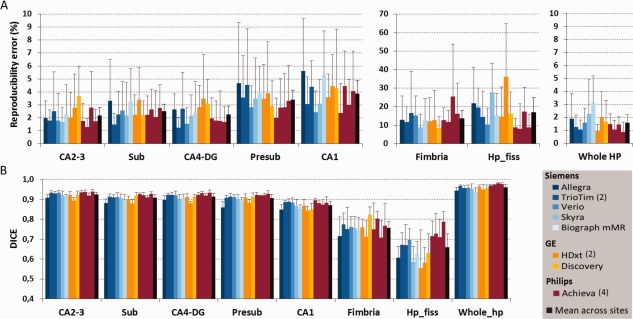
Across session (A) volume reproducibility error and (B) spatial reproducibility (DICE coefficient) of whole and subfield hippocampus segmentations. The last black column shows for each region the averaged reproducibility metrics across sites. An MRI site effect was detected only for the reproducibility error of hippocampal fissure (KW test, P = 0.014) and for the DICE of all structures (KW test, P = 0.017) except for fimbria. Error bars indicate the standard deviation on the mean. Abbreviations are the same of Figure 1. See Table 1 for MRI sites' description. [Color figure can be viewed in the online issue, which is available at http://wileyonlinelibrary.com.]