
Figure 4.
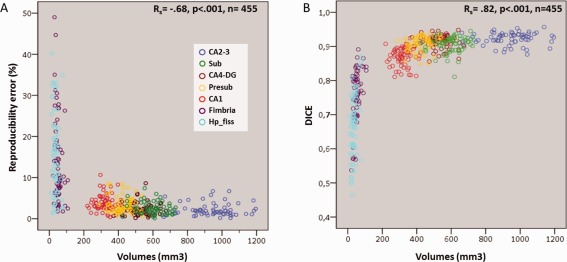
Scatter plots for subfields hippocampus segmentations showing the relationship between volumes and (A) reproducibility errors or (B) DICE coefficient. Circles indicate the subject volumes averaged across hemispheres and sessions. Abbreviations are the same of Figure 1. [Color figure can be viewed in the online issue, which is available at http://wileyonlinelibrary.com.]