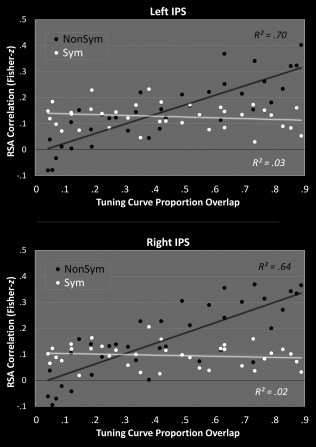
Figure 6.

The average Fisher‐z values (across 33 subjects) was plotted for each pair of numbers (Fig. 5) against the proportion of tuning curve overlap for those two numbers (assuming an analogue representation, see Fig. 1). Note that a log‐fit was similar for both formats (nonsymbolic: left: R 2 = 0.68, right: R 2 = 0.64; symbolic: left: R 2 = 0. 01, right: R 2 = 0.01).
