
Figure 1.
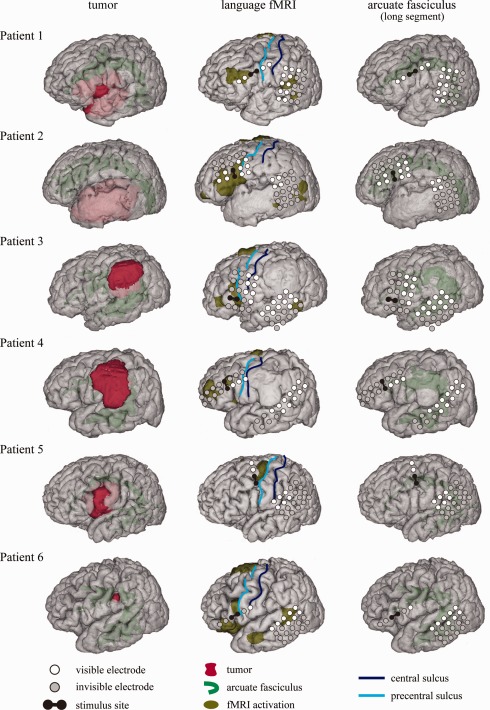
Noninvasive anatomo‐functional mapping of the dorsal language network. The left column: 3D MRI shows the long segment of the AF (green) and the tumor (red) around the AF. The middle column: The anterior and posterior perisylvian language cortices defined by shiritori word generation fMRI (dark yellow) are shown in comparison with the subdural electrodes. Only the activation areas outside the pre‐ and postcentral gyri are shown for clarity. White circles denote visible electrodes in the operative view, and gray circles invisible electrodes. Note that the frontal CCEP stimulus site (a black pair of electrodes) corresponded with the anterior language area defined by fMRI in all patients. The right column: The AF tracts (green) were shown in comparison with subdural electrodes.