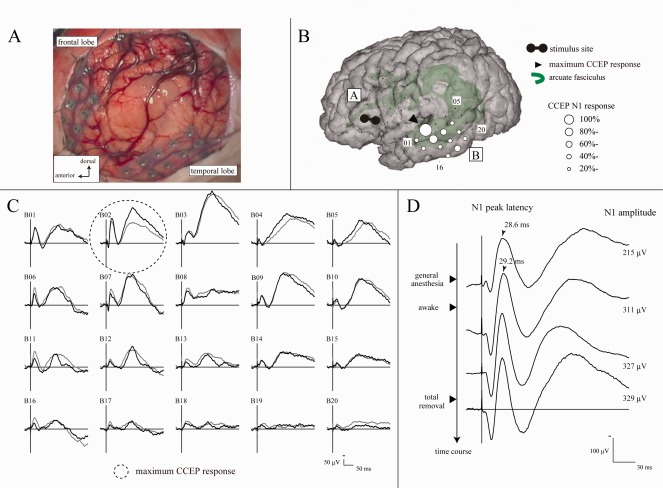
Figure 4.

Intraoperative online language network mapping by CCEPs (Patient 3). A: Electrode configuration in the intraoperative view. B: CCEP distribution map during general anesthesia. CCEP distributed over the middle to posterior part of the superior, middle and inferior temporal gyri (the maximum at Electrode B02 in the superior temporal gyrus). C: CCEP waveforms (Plate B) in the awake condition (before tumor removal). Two trials are plotted in superimposition. CCEP distribution did not change between general anesthesia and awake condition. D: Change of the N1 amplitude during surgery at the maximum CCEP response site (Electrode B02). CCEP waveforms are sequentially shown from the top to the bottom along the time course of surgery. As the patient awoke, the N1 amplitude increased from 215 to 311 µV (+45%). After tumor removal the N1 amplitude did not decline (329 µV). She did not show language dysfunction during or after surgery. Other conventions are the same as for Figure 3.
