
Figure 5.
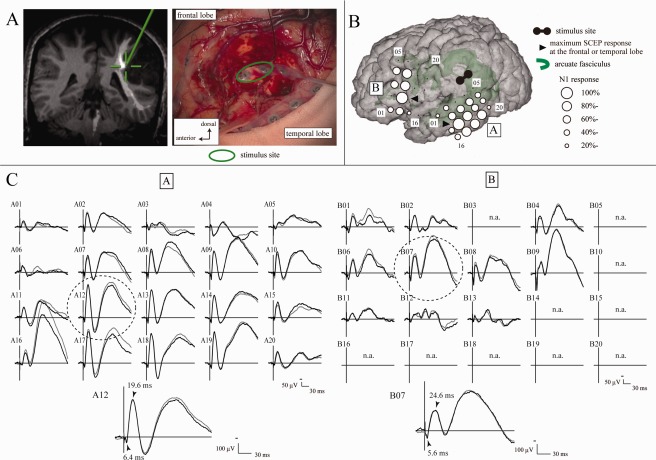
SCEPs in Patient 3. A: Site of white matter stimulation. Electrode pair (highlighted by a green circle) was stimulated at the floor of the removal cavity (right). The stimulus site (cross hairs) was attached to the AF (long segment) in the neuro‐navigation (left). High‐frequency (50 Hz) stimulation at this site induced the arrest of naming. B: SCEP distribution in the frontal and temporal areas. Circle maps were made separately for SCEP responses in the frontal (SCEPWM→AL) and temporal (SCEPWM→PL) areas, based on the SCEP amplitude percentage distribution. C: SCEPWM→AL (Plate B) and SCEPWM→PL (Plate A) waveforms. The largest response was highlighted with a dotted circle and its onset and peak latencies are shown in the enlarged waveform at the bottom. n.a. = SCEP was not available due to the limited number of channels available for simultaneous monitoring or high impedance in the recording electrode. Other conventions are the same as for Figure 4.