
Figure 3.
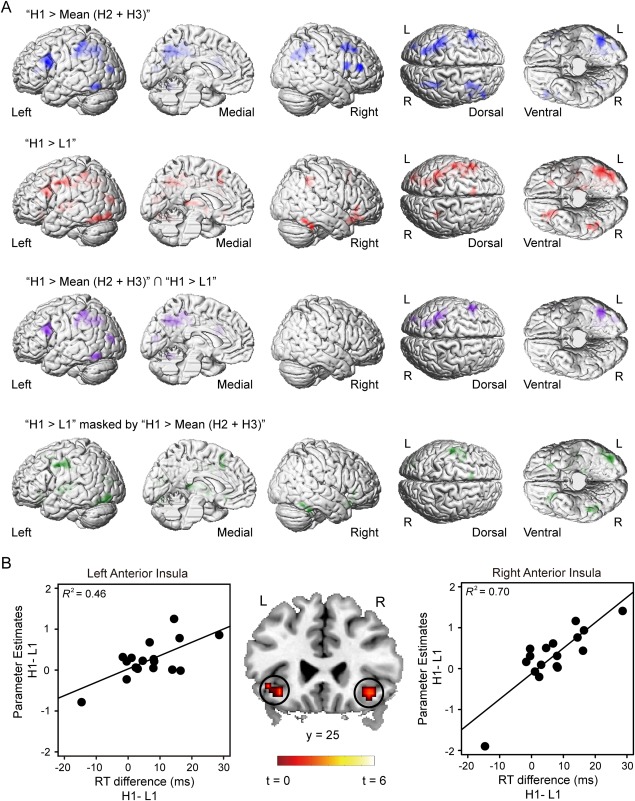
Results of the whole brain analysis for the test phase. A: Blue: the activations revealed by the contrast “H1 > Mean (H2 + H3)”. Red: the activations revealed by the contrast “H1 > L1.” Purple: the common activated regions of the two networks. Green: the brain activations revealed by the contrast “H1 > L1” exclusively masked by the contrast “H1 > Mean (H2 + H3)”. Statistical parametric map was shown at the threshold of P < 0.005 FWE‐corrected at cluster level, P < 0.005 uncorrected at voxel level (H1: high‐reward distractor, location 1; H2: high‐reward distractor, location 2; H3: high‐reward distractor, location 3; L1: low‐reward distractor, location 1). B: AI was activated by the contrast “H1 > L1” when the RT difference between H1 and L1 conditions were included as covariates (middle panel). Parameter estimates were extracted from the two clusters. Scatter plots (with best‐fitting regression lines) illustrates the difference of the parameter estimates between H1 and L1 conditions as a function of the RT difference (left and right panels). In the right panel, the correlation was still significant after the outlier (the bottom left dot) is excluded from the data (R 2 = 0.59). Thus, we keep all the data points in the plot. Note that the bottom left dot in the right panel was identified as the only outlier because the activity strength (the value of parameter estimates) of this dot in the right AI was beyond −3SD of the group mean. No outlier was found in the left panel.