
Figure 5.
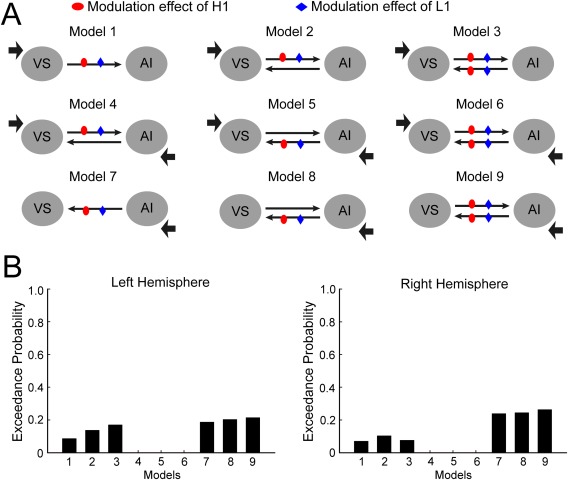
The DCM analysis for AI and VS. A: The structure of 12 models with different intrinsic connectivities and modulatory connectivities. B: The exceedance probabilities of the 12 models in the left (left panel) and the right (right panel) hemisphere. [Color figure can be viewed in the online issue, which is available at http://wileyonlinelibrary.com.]