
Figure 6.
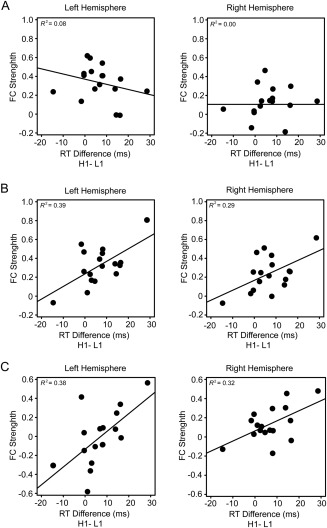
Results of the resting‐state fMRI. Scatter plots (with best‐fitting regression lines) illustrates the FC strength between the AI and the VS in the pre‐learning session (A), post‐learning session (B), and the difference in FC strength between the two sessions (C) as a function of the RT difference between H1 and L1 conditions. Note that for both the behavioral interference effect and the FC strength, all of the individual observations were within ± 3SD of the group mean.