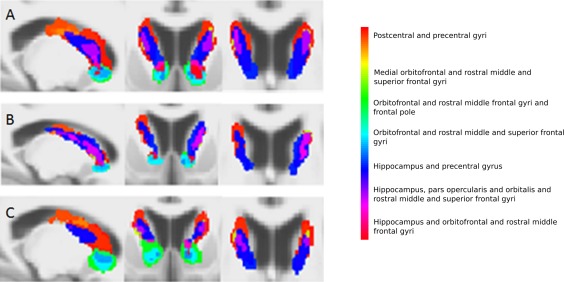
Figure 2.

Group‐averaged voxel connectivity profiles in the caudate for controls (A), premanifest Huntington's disease subjects (B) and early manifest Huntington's disease subjects (C). From left to right, sagittal, coronal and axial views are seen. A voxel connectivity profile was defined as the binary pattern of connections at a voxel. Every unique voxel connectivity profile was given a unique label and colour, and every basal ganglia voxel was assigned a colour corresponding to its voxel connectivity profile label. The anatomical regions to which each colour corresponds are displayed alongside. The voxel size of the group‐averaged voxel connectivity profiles is 1 mm isotropic. The voxel connectivity profiles were generated for each subject and averaged within each group separately; each subject group had a different set of voxel connectivity profiles, reflecting the differing patterns of connectivity in the premanifest and manifest Huntington's disease subjects and controls. The voxel connectivity profile labels were therefore reviewed and standardized across the groups after their initial creation to ensure comparability between groups. As shown in Figures 2, 3, 4, 5, colour maps of the basal ganglia voxel connectivity profiles for each subject group were generated from the standardised labels to allow visual comparison of connectivity patterns within the groups. [Color figure can be viewed in the online issue, which is available at http://wileyonlinelibrary.com.]
