
Figure 1.
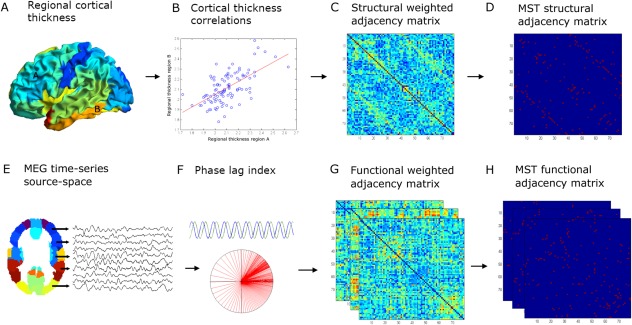
Overview of the applied methods: (A) regional cortical thickness was estimated by computing the distance between the surfaces of the pial and white matter layers as obtained from T1‐weighted structural images. We then used the AAL atlas (78 cortical areas) to obtain an average cortical thickness value across the vertices within a region of interest (ROI). (B) Cortical thickness correlations between all possible pair of regions were subsequently computed across subjects to obtain a structural adjacency matrix at the group level (C). From this, (D) the minimum spanning tree (MST), an unique acyclic subnetwork, was obtained. (E) MEG time‐series were projected with a beamformer approach onto the same AAL atlas parcellation. (F) The phase lag index (PLI) was computed as a measure of functional connectivity between regions to obtain a frequency‐dependent functional adjacency matrix (G). Subsequently, the MST was computed (H). For both structural and functional data, the weighted adjacency matrices were normalized (by dividing each link weight by the mean link weight of that adjacency matrix) to minimize biases due to differences in average connectivity. Network measures were computed for the complete weighted networks and for the MSTs. [Color figure can be viewed in the online issue, which is available at http://wileyonlinelibrary.com.]