
Figure 2.
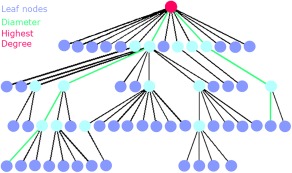
Explanation of the MST metrics: The MST is a subnetwork of the original network that does not contain loops or triangles. Here an MST is depicted, where the circles correspond to nodes and the (structural or functional) connections by lines. Leaf nodes, that is, end nodes with 1 connection (a degree of 1), are colored dark blue. The pink node is the node with the highest number of connections. The diameter is the longest shortest path in the network, here depicted in the connecting green lines. Two other measures that were computed are degree divergence (broadness of the degree distribution) and tree hierarchy. A low tree hierarchy corresponds to a more path‐like topology, whereas a high tree hierarchy to a more star‐like topology (see also Table 2). [Color figure can be viewed in the online issue, which is available at http://wileyonlinelibrary.com.]