
Figure 3.
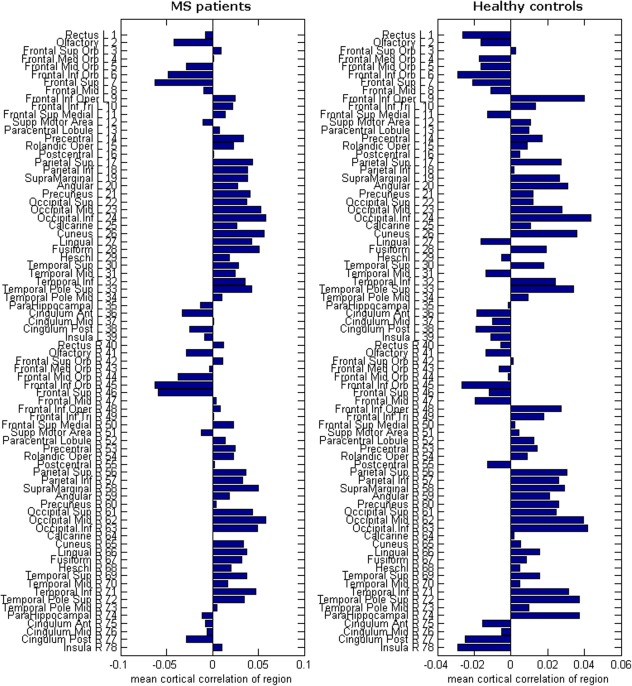
Mean cortical correlation values: Here we show the mean raw correlation value for each region. These values are obtained by averaging over all row elements of the structural covariance matrices in Supporting Information Figure S1. Depicted on the right of the horizontal bar plots are the corresponding AAL regions. The number next to each name also corresponds to the numbers in Supporting Information Figure S1. [Color figure can be viewed in the online issue, which is available at http://wileyonlinelibrary.com.]