
Figure 5.
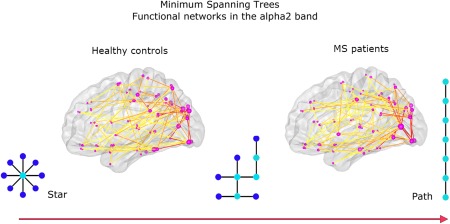
MST results for functional networks in the alpha2 band: For illustrative purposes, the average MSTs across subjects for MS patients and healthy controls are depicted. The diameter of the circles in the glass brains is proportional to the degree of the nodes in the MST; the color of the lines connecting the circles indicates the strength of the functional connections, with warmer colors indicating stronger connections. The MST for MS patients was characterized by a shift toward a more path‐like topology reflected by a lower leaf fraction, lower degree divergence, and lower tree hierarchy. [Color figure can be viewed in the online issue, which is available at http://wileyonlinelibrary.com.]