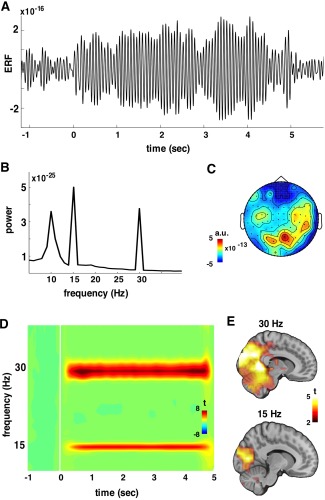
Figure 2.

SSR merged across experimental phases (habituation, conditioning, extinction) and stimuli (CS+ and CS−). The grand average SSR (filtered 2–25 Hz) from a posterior magnetometer is plotted in panel A including pre and poststimulus periods. In panel B, the whole‐head power spectrum clearly shows peaks at the stimulation frequency (15 Hz) and its harmonic (30 Hz). The topography of the SSR on sensor level (magnetometers) is illustrated in C, where activation is maximized at posterior sensors. In panel D, whole‐head time‐frequency representation of SSR on gradiometers is depicted. SSRs are observable at 15 Hz and 30 Hz. By contrasting pre vs. poststimulus period the SSR was mainly localized on occipital gyri (BA 18 and 19) as shown in panel E, being overall stronger and more widespread for 30 Hz.
