

Abstract
Loss in insight is a major feature of frontotemporal dementia (FTD) but has been investigated relatively little. More importantly, the neural basis of insight loss is still poorly understood. The current study investigated insight deficit profiles across a large cohort of neurodegenerative patients (n = 81), including FTD and Alzheimer's disease (AD) patients. We employed a novel insight questionnaire, which tapped into changes across different domains: social interaction, emotion, diagnosis/treatment, language, and motivation. FTD subtypes varied considerably for insight loss, with the behavioral variant worst and the progressive non‐fluent variant least affected. All other subtypes and AD showed milder but consistent insight loss. Voxel‐based morphometry analysis revealed that overall insight loss correlated with ventromedial and frontopolar prefrontal atrophy, with exception of social interaction and emotion insight loss, which additionally correlated with lateral temporal and amygdala atrophy, respectively. Our results show that patients with neurodegenerative conditions show variable loss of insight, with ventromedial and frontopolar cortex regions appearing to be particularly important for insight. Hum Brain Mapp 35:616–626, 2014. © 2012 Wiley Periodicals, Inc.
Keywords: frontotemporal dementia, Alzheimer's disease, insight, self‐evaluation, ventromedial frontal cortex, frontopolar cortex, voxel‐based morphometry
INTRODUCTION
Loss of insight is defined as a lack of awareness of mental symptoms due to frank denial or unconcern for their consequences and is a major feature of frontotemporal dementia (FTD). Over three quarters of FTD cases present with insight loss (Neary et al.,1998; Piguet et al.,2009; Rascovsky et al.,2011), yet insight is little understood and virtually no studies to date have attempted to establish neural markers of insight deficits in FTD.
Studies using semi‐structured clinician interviews (Evers et al.,2007), patient‐caregiver discrepancies on rating‐scales (Eslinger et al.,2005a; Salmon et al.,2008b), and comparisons of patient predicted‐ versus actual‐ performance (O'Keeffe et al.,2007; Williamson et al.,2010) have revealed overall insight impairment in FTD which may affect insight into cognitive and behavioral domains differentially. For example, Eslinger and colleagues (2005b), compared patient and caregiver ratings of social and behavioral changes, and found more severe insight impairment in FTD than Alzheimer's disease (AD) when patient perception of executive function, memory, attention, motivation, initiation, and empathy declines were explored. Using a similar method, Salmon et al. (2008a) detected equivalent AD‐FTD differences in insight concerning executive function and behavioral domains but failed to identify differences for memory or attention domains, suggesting that insight may vary across these domains even where comparable assessment formats are used. Comparisons of patient‐predicted test performance with actual performance studies compliment these findings. While both AD and FTD patients overestimated their performance, compared with healthy controls, on everyday functions (e.g., paying a bill) and cognitive tasks (e.g., memory), FTD patients were more inaccurate in their evaluations than AD patients (Williamson et al.,2010). These results suggest that insight domains can be differentially affected in FTD. Evers et al. (2007) explored this further by investigating insight in FTD patients with a semi‐structured clinical interviews to assess state awareness (i.e., perception of impairments, recognition that they are problems), disease awareness (i.e., insight into fact that impairments are symptoms of illness), and medical awareness (i.e., insight into fact that altered state is due to FTD). The majority of FTD patients showed no state, illness or medical awareness.
Compared with behavioral variant FTD (bvFTD) little is known about insight in patients with the language subtypes of FTD; progressive non‐fluent aphasia (PNFA) and semantic dementia (SD). Only three studies so far have attempted to split the behavioral variant from the progressive aphasic subtypes for insight evaluation. Banks and Weintraub (2009) conducted two studies, which both confirmed the clinical impression that insight deficits are particularly pronounced in bvFTD compared with the language variants and to AD. A similar study by Eslinger et al., (2005a) showed insight deficits in bvFTD, with an overestimation of the patients own ability across most domains, including self‐monitoring, empathy, attention, memory, planning, initiation, flexibility, and apathy. Importantly, Eslinger et al. split the language patients into PNFA and SD subtypes; both variants had significant discrepancy scores with carers for apathy, while SD patients showed less insight into changes in perspective taking and empathy than PNFA patients.
Recently, a third variant of PPA, logopenic progressive aphasia (LPA) has been identified that is characterized by anomia, word finding pause, variable phonological errors, and a marked deficit in sentence repetition in association with atrophy and hypometabolism of the left inferior parietal‐superior temporal (angular gyrus) region (Gorno‐Tempini et al.,2008; Leyton et al.,2011a; Rohrer et al.,2009). Importantly the pathological basis of LPA appears to be Alzheimer's rather than one of the variants of FTD based on a small number of autopsied cases and a recent PET study using the β‐amyloid ligand PiB (Leyton et al.,2011a). From the perspective of our investigation, there have been no reports of insight in LPA which we hypothesize might be more similar to that seen in patients with AD.
The neural correlates of loss of insight are virtually unexplored. To our knowledge, only two studies has attempted to investigate the functional neural correlates of insight in FTD using FDG‐PET and SPECT (McMurtray et al.,2006; Ruby et al.,2007). Ruby et al. showed that lack of insight into social impairments was associated with decreased metabolic activity in the left temporal pole in bvFTD. No neural correlates were detected, however, for insight impairments in other domains examined (i.e. changes in personality, empathy, behavior), although the accompanying questionnaire showed insight deficits across all those domains. The SPECT study by McMurtray et al. found instead that overall loss of insight was associated with hypoperfusion in right frontal lobe regions. This frontal involvement is also seen in functional neuroimaging studies in healthy, young participants, who show consistent activations of the ventromedial prefrontal cortex regions during self‐evaluation or self‐judgment tasks (van der Meer et al.,2010). The same region is known to be affected in bvFTD from an early disease stage (Seeley et al.,2008) and has been implicated in other behavioral disturbances in bvFTD, notably disinhibition (Hornberger et al., 2011). Surprisingly, however, no study to date as addressed whether specific grey matter atrophy region in neurodegenerative conditions are related to insight loss. Identification of such atrophy regions would have large implications for clinical and diagnostic purposes, in particular in conditions such as FTD with prevailing insight loss.
This study aimed to address several outstanding issues by: (1) employing a novel insight questionnaire, which encompasses social, emotional, cognitive and disease domains; (2) comparing insight across a large number of FTD patients with different subtypes (bvFTD, SD, PNFA); (3) comparing the FTD patients insight deficit with two related conditions (AD, LPA); and (4) exploring the grey matter correlates of the different insight domains using voxel‐based morphometry. Our predictions were that, similar to previous studies, FTD patients would show different profiles of insight deficits across domains, with bvFTD showing the most severe deficits. On current evidence it is likely that SD would also show deficits, while PNFA patients should have virtually no loss of insight, once LPA patients are excluded from this group. Finally, we hypothesized that ventromedial prefrontal cortex atrophy would correlate with insight deficits, mirroring functional neuroimaging studies in the healthy.
METHODS
Case Selection
A total of 81 patients participated comprising of 24 bvFTD, 18 SD, 13 PNFA, 15 AD, and 11 LPA patients. Patients were sourced from the FRONTIER Dementia Clinic (Sydney, Australia) and INECO Dementia and Memory Clinic (Buenos Aires, Argentina) databases. FTD patients met current consensus FTD criteria with insidious onset, decline in social behavior and personal conduct, emotional blunting and loss of insight (Neary et al.,1998; Rascovsky et al.,2011), while AD patients fulfilled NINCDS‐ADRDA criteria for probable AD (Tierney et al.,1988). All patients underwent general cognitive screening with the Addenbrooke's Cognitive Examination (ACE‐R) (Mathuranath et al., 2000, Mioshi et al., 2006) to determine their overall cognitive functioning. The ACE‐R is a 100 point evaluation that assesses five cognitive domains: attention/orientation, memory, fluency, language and visuospatial. Behavioral disturbances in the patients were assessed via the Cambridge Behavioral Inventory Revised (CBI‐R). The CBI‐R is an 81 item questionnaire that assesses cognitive, behavioral and affective symptoms as well as activities of daily living and evaluates various functional/behavioral domains using a five‐point rating scale (Wear et al., 2008). The research study was approved by the Human Ethics Committees of the Central and South Eastern Sydney Area Health Services and The Universities of Sydney and New South Wales and complies with the statement on human experimentation in the Declaration of Helsinki.
Insight Questionnaire
All patients completed a 28‐item insight questionnaire while their primary caregiver completed a complimentary version (i.e., with items rephrased to reflect carer rather than patient perspective). The 28‐items were divided into five subscales: social interaction, emotion, diagnosis/treatment, language and motivation/organization. Those specific subscales were selected on the typical impairment in FTD patients and thus the questionnaire differs from previously established insight questionnaire for other dementia. The social interaction sub‐items were inquiring about social interaction in general, as well as saying or doing inappropriate things, thus tapping into social appropriateness and inhibitory functioning. The emotion subscale targeted in particular empathy by asking whether there were any problems with sympathizing with other people or understanding other people's emotions. The diagnosis/treatment section asked specifically whether there is a brain condition and whether this warrants seeing a medical professional. The language subsection asked about difficulties of expressing oneself but also finding the right words and understanding other people. Finally, motivation/organization inquired about how motivated, organized, and well planned people are. Each item requiring a yes/no (i.e., agreement/disagreement) response to a given statement (e.g. “I believe I have a brain condition”).
The insight questionnaire was validated using Rasch analysis (Bond and Fox,2007). To verify construct validity, items were included if they fit the recommended limits of infit and outfit values (MNSQ 0.60 to 1.49 and Z 2 to 2). Mean infit statistics (M = 0.99; Z = −0.1, SD = 1.0) and outfit statistics (M = 1.04; Z = 0.2, SD = 0.41) confirmed that, overall, this choice of items produced a smooth continuum without outliers. To verify unidimensionality, which is a trait that assures that the scale is measuring one construct only, in this case insight, a principal component analysis (PCA) of the residuals was performed. This produced good Eigen values for the five contrasts (1.2–3.0). The raw variance explained was 38.54%, which was very close to the desired 50%. Further comparison of positive and negative loaded variables confirmed the unidimensionality of the scale. Test consistency was 0.94, virtually reaching the desirable Cronbach < 0.95. The item separation index of the scale was 4.05, which was close to the desired level of 3.0. Concurrent validity was done via comparison of insight discrepancy scores with discrepancy scores (carer‐patient) on the CBI‐R, which showed great relationship (r = 0.984; P < 0.001).
Discrepancy scores were calculated by subtracting the caregiver's scores (i.e., overall and for each subscale) from those of the patient resulting in three types of scores: (1) negative (i.e., caregiver perceives greater deficits in the patient than the patient themself); (2) neutral (i.e., patient and caregiver agree on presence/absence of impairments); and (3) positive (i.e., patient perceives greater impairments than caregiver). Thus, if a patient response was actually accurate (e.g., if the patient claimed their social interaction was normal because there was in fact no impairment), the carer's response would presumably agree (i.e., the carer would also describe patient social interaction as normal) and a 0 discrepancy score would be awarded, indicating intact insight. Subscores for each of the five subscales were calculated by adding all answers for each subscale. The overall insight scores is the sum of all subscale discrepancy scores.
Imaging Acquisition
A subgroup of 50 Sydney based patients underwent structural neuroimaging, which comprised 13 bvFTD, nine SD, eight PNFA, 13 AD, and seven LPA patients All patients underwent the same imaging protocol with whole‐brain T1 and DTI‐weighted images using a 3T Philips MRI scanner with standard quadrature head coil (eight channels). The 3D T1‐weighted sequences were acquired as follows: coronal orientation, matrix 256 × 256, 200 slices, 1 × 1 mm2 in‐plane resolution, slice thickness 1 mm, TE/TR = 2.6/5.8 ms. Importantly, the neuroimaging cohort did not differ significantly from the main cohort (n = 81) on any demographic or insight measures.
Voxel‐Based Morphometry (VBM) Analysis
3D T1‐weighted sequences were analyzed with FSL‐VBM, a voxel‐based morphometry analysis (Ashburner and Friston,2000; Good et al.,2001) which is part of the FSL software package http://www.fmrib.ox.ac.uk/fsl/fslvbm/index.html (Smith et al.,2004). First, tissue segmentation was carried out using FMRIB's Automatic Segmentation Tool (FAST) (Zhang et al.,2001) from brain extracted images. This resulted in tissue segmentation of (i) grey matter, (ii) white matter, and (iii) CSF via a hidden Markov random field model and an associated Expectation‐Maximization algorithm. The FAST algorithm also corrected for spatial intensity variations such as bias field or radio‐frequency inhomogeneities in the scans, resulting in partial volume maps of the scans. The resulting gray matter partial volume maps were then aligned to the Montreal Neurological Institute standard space (MNI152) using the nonlinear registration approach using FNIRT (Andersson et al.,2007a, 2007b), which uses a b‐spline representation of the registration warp field (Rueckert, et al.,1999). The registered partial volume maps were then modulated (to correct for local expansion or contraction) by dividing them by the Jacobian of the warp field. The modulated images were then smoothed with an isotropic Gaussian kernel with a standard deviation of 3 mm (FWHM: 8 mm). Finally, the statistical analysis was performed by employing a voxel‐wise general linear model. Significant clusters were formed by employing the threshold‐free cluster enhancement (TFCE) method (Smith and Nichols,2009). The TFCE method is a cluster‐based thresholding method which does not require the setting of an arbitrary cluster forming threshold (e.g. t,z < 4), instead it takes a raw statistics image and produces an output image in which the voxel‐wise values represent the amount of cluster‐like local spatial support. The TFCE image is then turned into voxel‐wise P‐values via permutation testing. We employed a permutation‐based non‐parametric testing with 5,000 permutations (Nichols and Holmes,2002). We build a regression model with the performance on the insight questionnaire as the explanatory variable of main interest and disease severity (CDR) and total intracranial volume (TIV) as covariates. A covariate only statistical model with a [1 0 0] t‐contrast was used, providing an index of association between decreasing grey matter volume and lower scores on the insight measure while taking disease severity and TIV across patients into account. Differences in grey matter intensity were considered significant at P < 0.001, False discovery rate (FDR) corrected for each voxel. In addition, we applied a threshold of at least 20 contiguous voxels for each significant cluster to reduce the likelihood of false positive voxels.
Statistics
Using SPSS17.0 (SPSS, Chicago, IL), one‐way ANOVA's were conducted to compare demographic (i.e. age and education) and neuropsychological data across diagnostic groups. A priori, variables were plotted and checked for normality of distribution by Kolmogorov‐Smirnov tests. Variables revealing non‐normal distributions were log transformed and the appropriate log values were used in the analyses. Variables showing non‐parametric distribution after log transformation were analyzed via Chi‐square, Kruskal‐Wallis and Mann‐Whitney U tests. To account for significant differences in severity, CDR was entered as a covariate before analyzing insight scores and performing Tukey post‐hoc tests.
RESULTS
Demographics
No significant differences of age, gender and education were found (P > 0.1). On general cognitive (ACE‐R) and behavioral (CBI) scores group differences were present across all tests (all P's < .05) (Table 1). Post‐hoc analyses shows that ACE‐R scores differed significantly between bvFTD and SD (P < 0.05), PNFA and SD (P < 0.05) and PNFA and LPA (P < 0.05) groups, indicating the low scores on this test in the SD and LPA groups. By contrast, on the CBI, PNFA patients had the lowest incidence of behavioral dysfunction compared to all other groups (P's < 0.01), except for the LPA patient group. Finally, scores on the CDR revealed the highest level impairment for AD patients, which differed significantly to LPA, PNFA, and SD groups (all P's < 0.05) but not bvFTD (P > 0.1). The CDR score was therefore employed as a covariate in all remaining behavioral and imaging analysis to account for these group differences.
Table 1.
Mean scores (SD) for bvFTD, SD, PNFA, AD and LPA patients on demographics, behavior, and general cognitive tests
| Demographics and cognitive tests | bvFTD | SD | PNFA | AD | LPA | F |
|---|---|---|---|---|---|---|
| N | 24 | 18 | 13 | 15 | 11 | – |
| Age | 63.13 (10.78) | 64.11 (9.19) | 63.64 (8.43) | 64.27 (9.10) | 63.64 (8.43) | n.s. |
| Education | 11.83 (3.34) | 13.10 (3.80) | 14.88 (4.27) | 12.87 (3.20) | 12.82 (3.08) | n.s. |
| Sex (M/F) | 18/6 | 13/5 | 9/4 | 12/3 | 4/7 | – |
| ACE (100) | 73.84 (12.60) | 60.88 (9.25) | 77.64 (10.58) | 67.53 (23.20) | 61.27 (10.05) | ** |
| MMSE (30) | 25.55 (3.69) | 24.06 (2.51) | 26.09 (2.90) | 22.07 (7.62) | 22.18 (3.54) | * |
| CBI | 58.73 (18.81) | 45.50 (21.57) | 19.33 (11.45) | 46.27 (32.89) | 33.64 (19.54) | *** |
| CDR | 3.53 (2.39) | 2.28 (1.77) | 1.14 (1.32) | 4.83 (2.39) | 2.56 (1.40) | *** |
Note: F values indicate differences across diagnostic groups. n.s. = non significant; *** = P < 0.001; ** = P < 0.01; * = P < 0.05.
Insight Questionnaire
Mean discrepancy scores for diagnostic groups, shown in Figure 1 and Table 2, were significantly different across all insight domains. A repeated measures ANOVA employing the factors of group (bvFTD, SD, PNFA, AD, LPA), insight domain (social interaction, emotion, diagnosis/treatment, language, and motivation/organization, overall insight), as well as CDR total as a covariate, revealed a significant interaction of group by domain (P < 0.001). Post‐hoc tests showed that groups differed significantly for social interaction, emotion, motivation/organization and overall insight (all P's < 0.05) but not the language and diagnosis/treatment domains. Not surprisingly, bvFTD patients differed on the overall insight score in comparison to all other patient groups (all P's < 0.05). PNFA patients were also significantly less impaired than SD patients (P < 0.05) but similar to AD and LPA.
Figure 1.
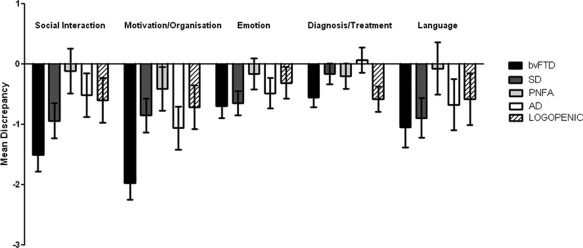
Mean insight discrepancy scores for each insight domain across diagnostic groups. AD = Alzheimer's disease; bvFTD = behavioral variant frontotemporal dementia; LPA = LPA progressive aphasia; PNFA = progressive non‐fluent aphasia; SD = semantic dementia. Error bars denote standard error of the mean.
Table 2.
Mean discrepancy scores (SD) for carer vs. patient insight evaluation across patient groups (bvFTD, SD, PNFA, AD and LPA)
| Questionnaire subscale | bvFTD | SD | PNFA | AD | LPA | F value across all groups |
|---|---|---|---|---|---|---|
| Social Interaction | −1.50 (.28) | −.94 (.29) | −.11 (.37) | −.51 (.36) | −.60 (.37) | ** |
| Motivation/Organisation | −1.97 (.28) | −.85 (.28) | −.41 (.36) | −1.06 (.36) | −.71 (.36) | ** |
| Emotion | −.69 (.20) | −.65 (0.20) | −.16 (.26) | −.48 (.25) | −31 (.26) | * |
| Diagnosis/Treatment | −.55 (.16) | −.16 (.17) | −.20 (.21) | .07 (.21) | −.58 (.21) | n.s. |
| Language | −1.05 (.33) | −.89 (.33) | −.07 (.43) | −.67 (.42) | −.58 (.43) | n.s. |
| Overall insight | −5.75 (.69) | −3.48 (.69) | −.95 (.88) | −2.64 (.87) | −2.78 (.89) | *** |
Note.F values indicate differences across diagnostic groups. *** = P < .001; ** = P < 0.01; * = P < 0.05.
More specific group comparisons revealed that bvFTD patients showed significantly less insight for social interaction in comparison to PNFA and AD patients (all P's < 0.05) and a statistical trend compared with the LPA group (P = 0.059). There was no significant difference between bvFTD and SD patients for this domain. For motivation/organization, bvFTD patients performed lower than all groups (P < 0.01), except AD. There were no significant group differences for the emotion insight domain.
Voxel‐Based Morphometry (VBM)
The insight discrepancy scores were entered as covariates in a VBM analysis to reveal areas of brain atrophy related to their insight performance. In a first analysis, entering the overall insight score revealed that bilateral orbitofrontal cortex, as well as right frontopolar cortex atrophy covarying with overall insight (Figs. 2 and 3, Table 3).
Figure 2.
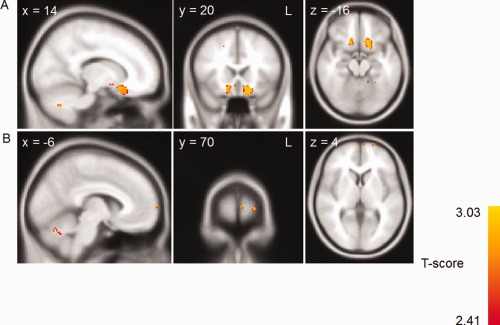
Voxel‐based morphometry analysis showing brain areas which correlate with the overall insight discrepancy score across patient groups. Clusters are overlaid on the MNI standard brain (t = 2.41). Colored voxels show regions that were significant in the analyses for P < 0 .001 FDR corrected and a voxel threshold of 20 contiguous voxels.
Figure 3.
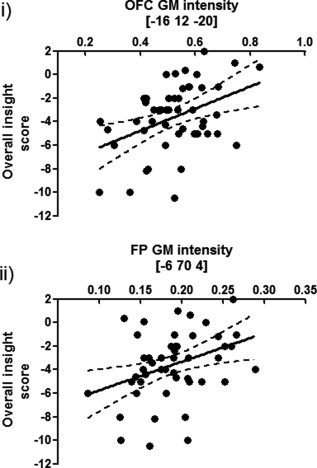
Scatterplot of grey matter (GM) intensity values at (i) orbitofrontal and (ii) frontopolar peak voxels and overall insight scores across all imaging participants. Black line indicates a best‐fit linear regression of scores; dashed lines indicate the 95% confidence intervals of the best‐fit linear regression.
Table 3.
Grey matter atrophy regions correlating with overall insight
| Region(s) | Hemisphere (L/R/B) | MNI coordinates | T‐score (peak voxel) | P‐value (cluster level) | |||
|---|---|---|---|---|---|---|---|
| X | Y | Z | No. of Voxels | ||||
| Orbitofrontal Cortex | L | −16 | 12 | −20 | 381 | 2.96 | 0.998 |
| Orbitofrontal Cortex | R | 16 | 20 | −20 | 120 | 2.96 | 0.996 |
| Frontal Pole | L | −6 | 70 | 4 | 20 | 2.72 | 0.998 |
| Frontal Pole | L | −22 | 70 | 4 | 20 | 2.72 | 0.994 |
The overall insight VBM analysis was followed up by separate VBM analyses using the domains for which there were significant group differences (social interaction, motivation/organization and emotion). Social interaction insight covaried with left orbitofrontal cortex, left parahippocampus, right middle temporal gyrus, bilateral insula, and right amygdala atrophy (Fig. 4 and Table 4). Similarly, motivation/organization insight correlated with bilateral orbitofrontal, left anterior cingulate, and right frontopolar atrophy (Fig. 4 and Table 5). Deficits in emotion insight were related to bilateral frontopolar atrophy, right dorsolateral prefrontal cortex, SMA, bilateral anterior cingulate, and left amygdala (Fig. 4 and Table 6).
Figure 4.
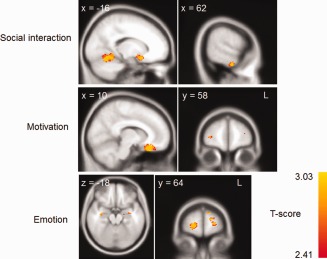
Voxel‐based morphometry analysis showing brain areas which correlate with the social interaction, motivation/organization and emotion insight domain scores across patient groups. Clusters are overlaid on the MNI standard brain (t = 2.41). Colored voxels show regions that were significant in the analyses for P < 0 .001 FDR corrected and a voxel‐threshold of 20 contiguous voxels.
Table 4.
Grey matter atrophy regions correlating with social interaction insight
| Region(s) | Hemisphere (L/R/B) | MNI Coordinates | T‐score (peak voxel) | P‐value (cluster level) | |||
|---|---|---|---|---|---|---|---|
| X | Y | Z | No. of Voxels | ||||
| Parahippocampal Gyrus | L | −28 | −8 | −36 | 215 | 2.72 | 0.998 |
| Orbitofrontal Cortex | L | −16 | 10 | −18 | 145 | 2.96 | 0.998 |
| Temporal Gyrus | L | −44 | −58 | −6 | 128 | 2.96 | 0.998 |
| Insular Cortex | L | −46 | −12 | 2 | 127 | 2.96 | 0.998 |
| Temporal Gyrus | R | 64 | −12 | −34 | 118 | 2.72 | 0.998 |
| Amygdala | R | 34 | −2 | −18 | 86 | 2.96 | 0.998 |
| Occipital Cortex | R | 28 | −58 | 34 | 64 | 2.96 | 0.998 |
Table 5.
Grey matter atrophy regions correlating with motivation insight
| Region(s) | Hemisphere (L/R/B) | MNI Coordinates | T‐score (peak voxel) | P‐value (cluster level) | |||
|---|---|---|---|---|---|---|---|
| X | Y | Z | No. of Voxels | ||||
| Orbitofrontal Cortex | B | −10 | 24 | −28 | 1536 | 2.96 | 0.998 |
| Anterior cingulate | L | −6 | 44 | 18 | 40 | 2.72 | 0.996 |
| Frontal Pole | R | 32 | 58 | 4 | 30 | 2.57 | 0.998 |
Table 6.
Grey matter atrophy regions correlating with emotion insight
| Region(s) | Hemisphere (L/R/B) | MNI Coordinates | No. of Voxels | T‐score (peak voxel) | P‐value (cluster level) | ||
|---|---|---|---|---|---|---|---|
| X | Y | Z | |||||
| Frontal Pole | L | −20 | 66 | 0 | 199 | 2.96 | 0.998 |
| Frontal Pole | R | 22 | 64 | −6 | 137 | 2.96 | 0.998 |
| Amygdala | L | −24 | −4 | −10 | 95 | 2.57 | 0.998 |
| Hippocampus | L | −34 | −10 | −16 | 52 | 2.57 | 0.998 |
In a final analysis, we analyzed all patient groups separately across all the domains. However, this analysis resulted in no significant results.
DISCUSSION
We have shown that insight in FTD patients relates primarily to the degree of atrophy of the ventromedial and frontopolar prefrontal cortices, with additional contributions of lateral temporal and amygdala pathology to insight deficits in the social interaction and emotion domains. The degree of insight also varies considerably across FTD subtypes, with bvFTD patients being the most and PNFA patients being the least affected. As predicted, insight deficits in LPA mirrored those in the AD group.
Insight deficits were investigated across groups for the domains of social interaction, emotion, and motivation/organization. Overall, the bvFTD patients showed the least insight into their symptoms across all domains, with social interaction and motivation/organization revealing the strongest discrepancies from the evaluations of their carers. This replicates previous findings in that bvFTD patients have the most severe insight problems across the FTD subtypes, as well as compared with AD (Bathgate et al.,2001; Eslinger et al.,2005a; Rankin et al.,2005). The largest discrepancies between patient and carer evaluations were for motivation (i.e. apathy) and social interaction. Interestingly, patients retained insight into language problems which contrasts with a previous report (Salmon et al.,2008b). For insight into emotional changes, we found marginal effects.
By contrast, PNFA patients showed the greatest insight. Indeed, for most domains PNFA patients and their carers rated symptoms similarly, indicating concordance in the symptom evaluation. The only prominent negative discrepancy score was observed for the motivation/organization domain. Only one prior study has reported insight in PNFA, which produced similar results in that PNFA patients showed an insight deficit for the apathy domain only (Eslinger et al.,2005b). Importantly, previous studies investigating the language variants of FTD predated the identification of the LPA syndrome so that an admixture of PNFA and LPA cases might have affected the insight deficits in the language FTD patients.
The SD, LPA, and AD groups showed insight discrepancy scores intermediate between the two extremes exhibited by bvFTD and PNFA groups. Interestingly, SD patients showed the least discrepancy for the diagnosis/treatment domain, indicating that they were relatively well aware of their brain condition. They also retained insight into their most profound deficit (i.e., language and communication) providing strong evidence for the fractionation of insight. Patients with AD also retained insight into their diagnosis and rated their need for treatment as high as their carers. Overall, the level of insight deficit demonstrated by AD patients was comparable to a previous report (Eslinger et al.,2005b). Insight in LPA has not been investigated previously. Overall, the LPA group showed mild deficits at a level almost identical to that of the AD group, a finding in accord with recent amyloid ligand PET imaging has confirmed previous suggestions that LPA represents a form of focal AD (Leyton et al.,2011b).
Turning to the neural basis of insight, the degree of ventromedial and frontopolar prefrontal cortical atrophy was shown to be strongly correlated to insight discrepancies between patients and their carers. At covariance analysis for overall insight showed a large bilateral cluster in ventromedial/orbitofrontal cortex as well as the left frontopolar region. Similar findings were found for the motivation/organization insight domain. A potential reason for the latter finding might be that the motivation/organization discrepancy scores were one of the largest contributors to the overall insight scores which could therefore have driven the atrophy correlates. Interestingly, for emotion and social interaction domains only the social interaction condition correlated with the degree of ventromedial prefrontal cortex atrophy. More importantly, the social interaction condition was related to the lateral temporal lobe which is similar to the FDG–PET findings reported by Ruby et al. (2007). Emotion insight correlates revealed an association with bilateral amygdala as well as more substantial bilateral frontopolar atrophy regions.
Most of these finding can be understood from the standpoint of what is known about the neural architecture of self‐reflective processes. The ventromedial prefrontal cortex has been implicated across a range of studies in self‐evaluation and insight processing (van der Meer et al.,2010). For example, functional MRI (fMRI) studies in healthy and ageing population have revealed that this region is consistently activated during judgments of self‐performance (Beer et al.,2010; Feyers et al.,2010; Modinos et al.,2011). Crucially, activity in this region has been found to correlate with overconfidence in self‐evaluations, indicating that a dysfunction in this region should lead to an overestimation of abilities (Beer and Hughes,2010). Impaired insight in psychiatric populations, and in particular schizophrenia, has been shown to relate to orbitofrontal cortex dysfunction (for a review see Shad et al.,2006). Similarly, in neurodegenerative conditions, atrophy in right ventromedial prefrontal cortex has been associated with poorer self‐evaluation (Rankin et al.,2004). The finding also links directly to the theory of mind deficits in bvFTD patients (Gregory et al.,2002; Lough et al.,2006), which require the evaluation of intent, feelings and emotional state of another person. Importantly, the ventromedial prefrontal cortex is known to be consistently affected early in the course of bvFTD (Seeley et al.,2008) which explains the pervasive insight deficits in this FTD subgroup. Interestingly, SD and AD patients can also show ventromedial damage, though to a much lesser degree than bvFTD, which is reflected in their milder but consistent insight deficits. Finally, PNFA patients have virtually no ventromedial damage, making them least susceptible to insight deficits.
Atrophy of the frontopolar cortex was closely related to virtually all insight domains. The specific function of frontopolar cortex is still controversially discussed, as it has been shown to be involved across a multitude of tasks (Burgess2011; Tsujimoto et al.,2011). Nevertheless, activity in this region has been linked to functional imaging studies of self‐evaluation tasks (Beer et al.,2010) and a recent study in FTD patients showed that prosocial sentiments, such as guilt and embarrassment, correlated with glucose uptake on FDG‐PET in frontopolar cortex (Moll et al.,2011).
In contrast to these regions which were almost consistently affected across insight domains, two other brain regions were specifically related to certain insight domains. Amygdala atrophy was related to emotion insight deficits but not other insight domains. It has been known for a long time that the intactness of the amygdala is crucial for emotion processing (Pessoa and Adolphs,2010) and that this region is consistently affected in bvFTD and in SD (Fernandez‐Duque and Black,2005; Rosen et al.,2002; Snowden et al.,2008). It is less clear why atrophy in this region would affect emotion insight specifically. This region may be important for reflecting on emotions by reinstating emotional states, which is defective in FTD. Clearly this needs to be further investigated in the future.
The second region was the lateral temporal lobe which correlated with social interaction insight deficits specifically. It is currently unclear what potential contribution of this region might have to insight problems. Gross changes in behavior are seen as part of the Klüver‐Bucy syndrome caused bilateral temporal damage (for a review see Olson et al.,2007) and a recent neuroimaging study linked disinhibition to this temporal regions (Hornberger et al., 2011). A growing body of functional imaging literature suggests that lateral temporal areas are involved in theory of mind processing (Saxe and Kanwisher,2003), which requires participants to reflect on other people's intentions (Frith and Frith,2010). Our results suggest that these regions are also engaged for self‐evaluation or insight.
In summary, loss of insight varies considerably across FTD subtypes and insight domains, with bvFTD patients showing overall the least insight and PNFA patients being virtually intact. Patients show a fractionation of insight with least insight into changes in social interaction, motivation, and emotion yet retain insight into language deficits and the fact that they suffer from a brain disease. Importantly, LPA patients show similar level of insight as seen in typical AD patients further substantiating the evidence that they belong to the AD spectrum disorders. Finally, atrophy in ventromedial prefrontal cortex, as well as frontopolar cortex appear responsible for a loss of insight in FTD, which complements fMRI findings. More importantly, there was a fractionation at a neural level with two regions (ventromedial, frontopolar) being consistently related to insight deficits, whereas two other regions (amygdala, lateral temporal lobe) were specific for only certain insight deficits. It is possible to measure insight and to predict on the basis of brain atrophy patterns whether insight is likely to be lost or retained. Further investigations into the role of the non‐frontal regions, notably the amygdala and temporal regions are needed. Longitudinal changes and the impact of disease modifying therapies will be of considerable interest.
Acknowledgments
The authors thank David Foxe, Sharon Savage, Sharpley Hsieh, and Felicity Leslie for questionnaire administration and helpful discussions.
REFERENCES
- Andersson JLR, Jenkinson M, Smith, S (2007a): Non‐linear optimisation. FMRIB technical report TR07JA2 from http://www.fmrib.ox.ac.uk/analysis/techrep.
- Andersson JLR, Jenkinson M, Smith S (2007b): Non‐linear registration, aka Spatial normalisation. FMRIB technical report TR07JA2 from http://www.fmrib.ox.ac.uk/analysis/techrep.
- Ashburner J, Friston KJ (2000): Voxel‐based morphometry—The methods. Neuroimage 11:805–821. [DOI] [PubMed] [Google Scholar]
- Banks SJ, Weintraub S (2009): Generalized and symptom‐specific insight in behavioral variant frontotemporal dementia and primary progressive aphasia. J Neuropsychiatry Clin Neurosci 21:299–306. [DOI] [PMC free article] [PubMed] [Google Scholar]
- Bathgate D, Snowden JS, Varma A, Blackshaw A, Neary D (2001): Behaviour in frontotemporal dementia, Alzheimer's disease and vascular dementia. Acta Neurol Scand 2001:367–378. [DOI] [PubMed] [Google Scholar]
- Beer JS, Hughes BL (2010): Neural systems of social comparison and the “above‐average” effect. Neuroimage 49:2671–2679. [DOI] [PubMed] [Google Scholar]
- Beer JS, Lombardo MV, Bhanji JP (2010): Roles of medial prefrontal cortex and orbitofrontal cortex in self‐evaluation. J Cogn Neurosci 22:2108–2119. [DOI] [PMC free article] [PubMed] [Google Scholar]
- Bond TG, Fox CM (2007):Applying the Rasch model—Fundamental measurement in the human sciences.Mahwah, New Jersey:Lawrence Erlbaum Associates. [Google Scholar]
- Burgess PW (2011): Frontopolar cortex: Constraints for theorizing. Trends Cogn Sci 15:242; author reply 243. [DOI] [PubMed] [Google Scholar]
- Eslinger PJ, Dennis K, Moore P, Antani S, Hauck R, Grossman M (2005a): Metacognitive deficits in frontotemporal dementia. J Neurol Neurosurg Psychiatry 76:1630–1635. [DOI] [PMC free article] [PubMed] [Google Scholar]
- Eslinger PJ, Dennis K, Moore P, Antani S, Hauck R, Grossman M (2005b): Metacognitive deficits in frontotemporal dementia. J Neurol Neurosurg Psychiatry 76:1630–1635. [DOI] [PMC free article] [PubMed] [Google Scholar]
- Evers K, Kilander L, Lindau M (2007): Insight in frontotemporal dementia: Conceptual analysis and empirical evaluation of the consensus criterion “loss of insight” in frontotemporal dementia. Brain Cogn 63:13–23. [DOI] [PubMed] [Google Scholar]
- Fernandez‐Duque D, Black SE (2005): Impaired recognition of negative facial emotions in patients with frontotemporal dementia. Neuropsychologia 43:1673–1687. [DOI] [PubMed] [Google Scholar]
- Feyers D, Collette F, D'Argembeau A, Majerus S, Salmon E (2010): Neural networks involved in self‐judgement in young and elderly adults. Neuroimage 53:341–347. [DOI] [PubMed] [Google Scholar]
- Frith CD, Frith U (2010): Mechanisms of Social Cognition. Annu Rev Psychol 63:287–313. [DOI] [PubMed] [Google Scholar]
- Good CD, Johnsrude IS, Ashburner J, Henson RN, Friston KJ, Frackowiak RS (2001): A voxel‐based morphometric study of ageing in 465 normal adult human brains. Neuroimage 14:21–36. [DOI] [PubMed] [Google Scholar]
- Gorno‐Tempini ML, Brambati SM, Ginex V, Ogar J, Dronkers NF, Marcone A, Perani D, Garibotto V, Cappa SF, Miller BL (2008): The logopenic/phonological variant of primary progressive aphasia. Neurology 71:1227–1234. [DOI] [PMC free article] [PubMed] [Google Scholar]
- Gregory C, Lough S, Stone V, Erzinclioglu S, Martin L, Baron‐Cohen S, Hodges JR (2002): Theory of mind in patients with frontal variant frontotemporal dementia and Alzheimer's disease: Theoretical and practical implications. Brain 125:752–764. [DOI] [PubMed] [Google Scholar]
- Hornberger M, Geng J, Hodges JR (2011): Convergent grey and white matter evidence of orbitofrontal cortex changes related to disinhibition in behavioural variant frontotemporal dementia. Brain 134:2502–2512. [DOI] [PubMed] [Google Scholar]
- Leyton CE, Villemagne VL, Savage S, Pike KE, Ballard KJ, Piguet O, Burrell JR, Rowe CC, Hodges JR (2011a): Subtypes of progressive aphasia: Application of the international consensus criteria and validation using {beta}‐amyloid imaging. Brain 134:3030–3043. [DOI] [PubMed] [Google Scholar]
- Leyton CE, Villemagne VL, Savage S, Pike KE, Ballard KJ, Piguet O, Burrell JR, Rowe CC, Hodges JR (2011b): Subtypes of progressive aphasia: Application of the International Consensus Criteria and validation using beta‐amyloid imaging. Brain 134:3030–3043. [DOI] [PubMed] [Google Scholar]
- Lough S, Kipps CM, Treise C, Watson P, Blair JR, Hodges JR (2006): Social reasoning, emotion and empathy in frontotemporal dementia. Neuropsychologia 44:950–958. [DOI] [PubMed] [Google Scholar]
- McMurtray AM, Chen AK, Shapira JS, Chow TW, Mishkin F, Miller BL, Mendez MF (2006): Variations in regional SPECT hypoperfusion and clinical features in frontotemporal dementia. Neurology 66:517–522. [DOI] [PubMed] [Google Scholar]
- Modinos G, Renken R, Ormel J, Aleman A (2011): Self‐reflection and the psychosis‐prone brain: An fMRI study. Neuropsychology 25:295–305. [DOI] [PubMed] [Google Scholar]
- Moll J, Zahn R, de Oliveira‐Souza R, Bramati IE, Krueger F, Tura B, Cavanagh AL, Grafman J (2011): Impairment of prosocial sentiments is associated with frontopolar and septal damage in frontotemporal dementia. Neuroimage 54:1735–1742. [DOI] [PMC free article] [PubMed] [Google Scholar]
- Neary D, Snowden JS, Gustafson L, Passant U, Stuss D, Black S, Freedman M, Kertesz A, Robert PH, Albert M, Boone K, Milller BL, Cummings J, Benson DF (1998): Frontotemporal lobar degeneration: A consensus on clinical diagnositc criteria. Neurology 51:1549–1554. [DOI] [PubMed] [Google Scholar]
- Nichols TE, Holmes AP (2002): Nonparametric permutation tests for functional neuroimaging: A primer with examples. Hum Brain Mapp 15:1–25. [DOI] [PMC free article] [PubMed] [Google Scholar]
- O'Keeffe FM, Murray B, Coen RF, Dockree PM, Bellgrove MA, Garavan H, Lynch T, Robertson IH (2007): Loss of insight in frontotemporal dementia, corticobasal degeneration and progressive supranuclear palsy. Brain 130:753–764. [DOI] [PubMed] [Google Scholar]
- Olson IR, Plotzker A, Ezzyat Y (2007): The Enigmatic temporal pole: A review of findings on social and emotional processing. Brain 130:1718–1731. [DOI] [PubMed] [Google Scholar]
- Pessoa L, Adolphs R (2010): Emotion processing and the amygdala: From a ‘low road’ to ‘many roads’ of evaluating biological significance. Nat Rev Neurosci 11:773–783. [DOI] [PMC free article] [PubMed] [Google Scholar]
- Piguet O, Hornberger M, Shelley BP, Kipps CM, Hodges JR (2009): Sensitivity of current criteria for the diagnosis of behavioral variant frontotemporal dementia. Neurology 72:732–737. [DOI] [PMC free article] [PubMed] [Google Scholar]
- Rankin KP, Baldwin E, Pace‐Savitsky C, Kramer JH, Miller BL (2005): Self awareness and personality change in dementia. J Neurol Neurosurg Psychiatry 76:632–639. [DOI] [PMC free article] [PubMed] [Google Scholar]
- Rankin KP, Rosen HJ, Kramer JH, Schauer GF, Weiner MW, Schuff N, Miller BL (2004): Right and left medial orbitofrontal volumes show an opposite relationship to agreeableness in FTD. Dement Geriatr Cogn Disord 17:328–332. [DOI] [PMC free article] [PubMed] [Google Scholar]
- Rascovsky K, Hodges JR, Knopman D, Mendez MF, Kramer JH, Neuhaus J, van Swieten JC, Seelaar H, Dopper EG, Onyike CU, Hillis AE, Josephs KA, Boeve BF, Kertesz A, Seeley WW, Rankin KP, Johnson JK, Gorno‐Tempini ML, Rosen H, Prioleau‐Latham CE, Lee A, Kipps CM, Lillo P, Piguet O, Rohrer JD, Rossor MN, Warren JD, Fox NC, Galasko D, Salmon DP, Black SE, Mesulam M, Weintraub S, Dickerson BC, Diehl‐Schmid J, Pasquier F, Deramecourt V, Lebert F, Pijnenburg Y, Chow TW, Manes F, Grafman J, Cappa SF, Freedman M, Grossman M, Miller BL (2011): Sensitivity of revised diagnostic criteria for the behavioural variant of frontotemporal dementia. Brain 134:2456–2477. [DOI] [PMC free article] [PubMed] [Google Scholar]
- Rohrer JD, Warren JD, Modat M, Ridgway GR, Douiri A, Rossor MN, Ourselin S, Fox NC (2009): Patterns of cortical thinning in the language variants of frontotemporal lobar degeneration. Neurology 72:1562–1569. [DOI] [PMC free article] [PubMed] [Google Scholar]
- Rosen HJ, Gorno‐Tempini ML, Goldman WP, Perry RJ, Schuff N, Weiner M, Feiwell R, Kramer JH, Miller BL (2002): Patterns of brain atrophy in frontotemporal dementia and semantic dementia. Neurology 58:198–208. [DOI] [PubMed] [Google Scholar]
- Ruby P, Schmidt C, Hogge M, D'Argembeau A, Collette F, Salmon E (2007): Social mind representation: Where does it fail in frontotemporal dementia? J Cognitive Neurosci 19:671–683. [DOI] [PubMed] [Google Scholar]
- Rueckert D, Sonoda LI, Hayes C, Hill DL, Leach MO, Hawkes DJ (1999): Nonrigid registration using free‐form deformations: Application to breast MR images. IEEE Trans Med Imaging 18:712–721. [DOI] [PubMed] [Google Scholar]
- Salmon E, Perani D, Collette F, Feyers D, Kalbe E, Holthoff V, Sorbi S, Herholz K (2008a): A comparison of unawareness in frontotemporal dementia and Alzheimer's disease. J Neurol Neurosurg Psychiatry 79:176–179. [DOI] [PubMed] [Google Scholar]
- Salmon E, Perani D, Collette F, Feyers D, Kalbe E, Holthoff V, Sorbi S, Herolz K (2008b): A comparison of unawareness in frontotemporal dementia and Alzheimer's disease. J Neurol Neurosurg Psychiatry 79:176–179. [DOI] [PubMed] [Google Scholar]
- Saxe R, Kanwisher N (2003): People thinking about thinking people. The role of the temporo‐parietal junction in “theory of mind”. Neuroimage 19:1835–1842. [DOI] [PubMed] [Google Scholar]
- Seeley WW, Crawford R, Rascovsky K, Kramer JH, Weiner M, Miller BL, Gorno‐Tempini ML (2008): Frontal paralimbic network atrophy in very mild behavioral variant frontotemporal dementia. Arch Neurol 65:249–255. [DOI] [PMC free article] [PubMed] [Google Scholar]
- Shad MU, Tamminga CA, Cullum M, Haas GL, Keshavan MS (2006): Insight and frontal cortical function in schizophrenia: A review. Schizophr Res 86:54–70. [DOI] [PubMed] [Google Scholar]
- Smith SM, Jenkinson M, Woolrich MW, Beckmann CF, Behrens TE, Johansen‐Berg H, Bannister PR, De Luca M, Drobnjak I, Flitney DE, Niazy RK, Saunders J, Vickers J, Zhang Y, De Stefano N, Brady JM, Matthews PM (2004): Advances in functional and structural MR image analysis and implementation as FSL. Neuroimage 23(Suppl 1):S208–S219. [DOI] [PubMed] [Google Scholar]
- Smith SM, Nichols TE (2009): Threshold‐free cluster enhancement: Addressing problems of smoothing, threshold dependence and localisation in cluster inference. Neuroimage 44:83–98. [DOI] [PubMed] [Google Scholar]
- Snowden JS, Austin NA, Sembi S, Thompson JC, Craufurd D, Neary D (2008): Emotion recognition in Huntington's disease and frontotemporal dementia. Neuropsychologia 46:2638–2649. [DOI] [PubMed] [Google Scholar]
- Tierney MC, Fisher RH, Lewis AJ, Zorzitto ML, Snow WG, Reid DW, Nieuwstraten P (1988): The NINCDS‐ADRDA Work Group criteria for the clinical diagnosis of probable Alzheimer's disease: A clinicopathologic study of 57 cases. Neurology 38:359. [DOI] [PubMed] [Google Scholar]
- Tsujimoto S, Genovesio A, Wise SP (2011): Frontal pole cortex: Encoding ends at the end of the endbrain. Trends Cogn Sci 15:169–176. [DOI] [PubMed] [Google Scholar]
- van der Meer L, Costafreda S, Aleman A, David AS (2010): Self‐reflection and the brain: A theoretical review and meta‐analysis of neuroimaging studies with implications for schizophrenia. Neurosci Biobehav Rev 34:935–946. [DOI] [PubMed] [Google Scholar]
- Williamson C, Alcantar O, Rothlind J, Cahn‐Weiner D, Miller BL, Rosen HJ (2010): Standardised measurement of self‐awareness deficits in FTD and AD. J Neurol Neurosurg Psychiatry 81:140–145. [DOI] [PMC free article] [PubMed] [Google Scholar]
- Zhang Y, Brady M, Smith S (2001): Segmentation of brain MR images through a hidden Markov random field model and the expectation‐maximization algorithm. IEEE Trans Med Imaging 20:45–57. [DOI] [PubMed] [Google Scholar]