
Figure 3.
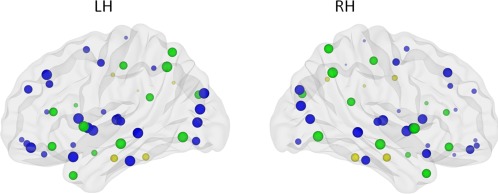
Image depicting significant main effect of hemisphere on efficiency. Size of the ROIs (spheres) represents value of the nodal efficiency for the right and left hemispheric network, collapsed across age groups. The colors of the nodes refer to: blue: regions with significant left‐greater‐than‐right asymmetries (P < 0.001), yellow: regions with significant right‐greater‐than‐left asymmetries (P < 0.001), green: not significant. [Color figure can be viewed in the online issue, which is available at http://wileyonlinelibrary.com.]