
Figure 4.
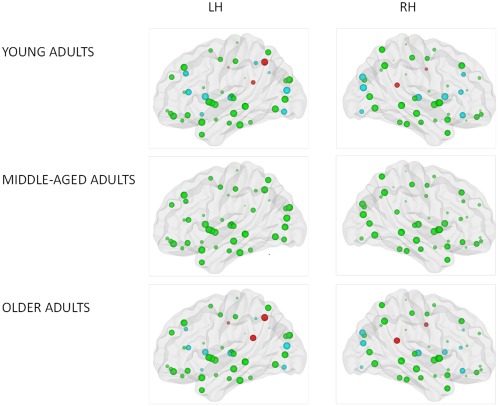
Figure illustrating significant main effect of age group on local efficiency. Size of the ROIs (spheres) represents value of the nodal efficiency for the right and left hemispheric network for each age group. The colors of the nodes refer to: red: higher nodal efficiency in older adults as compared to young adults (positive age effect) (P < 0.0005); blue: higher nodal efficiency in young adults as compared to older adults (negative age effect) (P < 0.0005), green: not significant. [Color figure can be viewed in the online issue, which is available at http://wileyonlinelibrary.com.]