Figure 3.

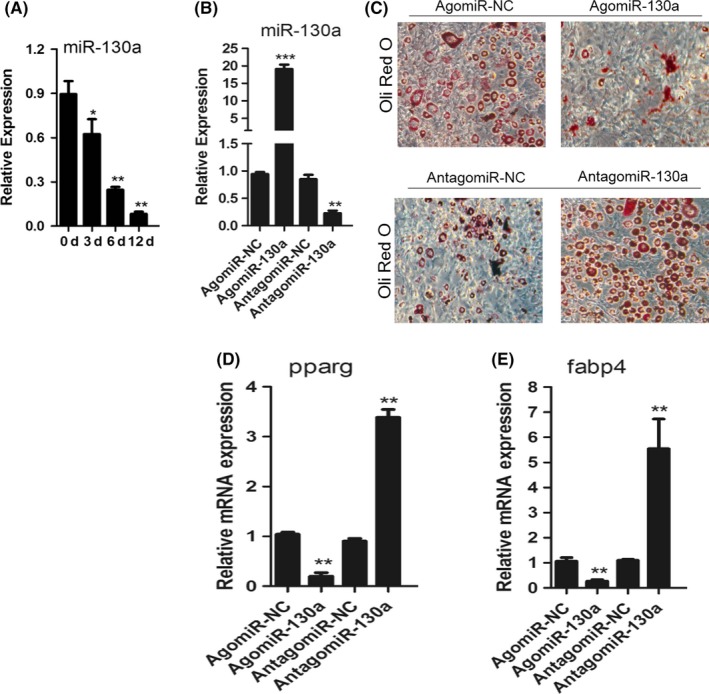
MiR‐130a inhibits adipogenic differentiation of BMSC. A, qRT‐PCR analysis of the relative levels of miR‐130a expression in BMSC cultured in adipogenesis induction medium (0.5 mmol/L 3‐isobutyl‐1‐methylxanthine, 5 μg/mL insulin and 1 μmol/L dexamethasone) for the days as indicated. n = 5 per group. B, qRT‐PCR analysis of the relative levels of miR‐130a expression in BMSC transfected with 10 μmol/L agomiR‐130a, antagomiR‐130a or their negative controls. NC, negative control. n = 5 per group. C, Representative images of Oil Red O staining of lipids in BMSC cultured in adipogenesis induction medium for 14 days. Scale bar: 100 μm. D and E, qRT‐PCR analysis of the relative levels of PPARG D, and Fabp4 E, mRNA expression in BMSC cultured in adipogenesis induction medium for 48 hours. Data shown as mean ± SD. *P < .05, **P < .01, ***P < .001 (ANOVA)
