Figure 4.

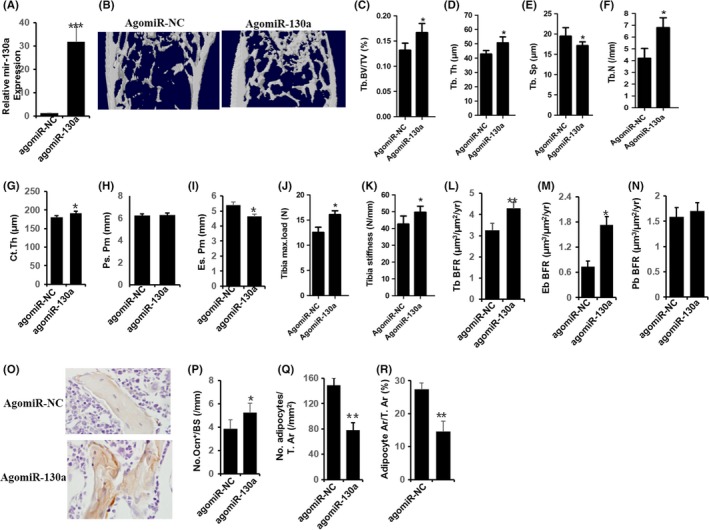
Overexpression of miR‐130a reduces bone loss in aged mice. A, qRT‐PCR analysis of levels of miR‐130a expression in BMSC of mice with agomiR‐130a or agomiR‐NC. NC, negative control. n = 6 per group. B‐I, Representative μCT images B, and quantitative μCT analysis of trabecular C‐F, and cortical bone G‐I, microarchitecture in femora of mice with agomiR‐NC or agomiR‐130a. n = 10. J and K, Three‐point bending measurement of femur maximum load J and stickness K. n = 5 per group. L‐N, Calcein double‐labelling–based quantification of bone formation rate per bone surface (BFR/BS) in femora. n = 5 per group. O‐R, Representative images of osteocalcin immunohistochemical staining O, and quantification of number of osteoblasts P, number and area of adipocytes Q and R, and in distal femora. Scale bars: 100 μm. n = 5 per group. Data shown as mean ± SD. *P < .05, ***P < .001 (Student's t test)
