
Figure 3.
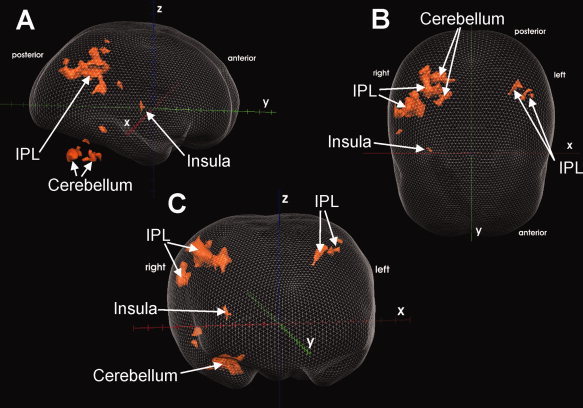
Lateral (A), top (B), and frontal (C) view of a glass brain, showing the supraspinal activations of 12 subjects during the DRAIN 1 condition at random effects level with t = 4.4 (P = 0.001). Only clusters ≥50 contiguous voxel are shown. For detailed description and coordinates of activated regions, see Table II. Talairach axes (x, y, z) are displayed for easier orientation. IPL = inferior parietal lobe.