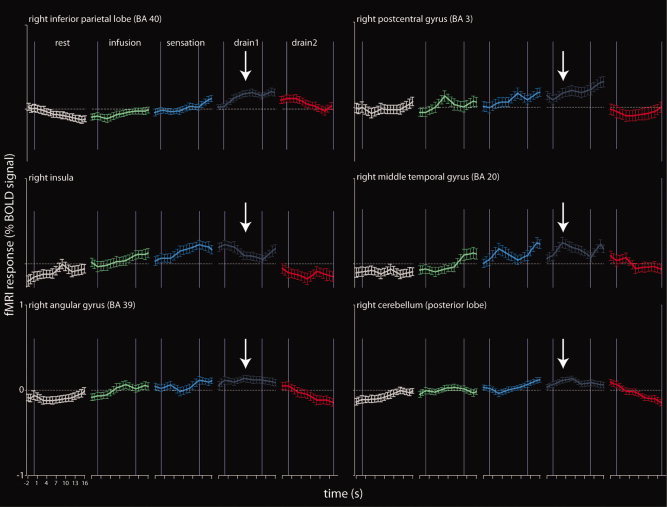
Figure 4.

The progression of the BOLD signal during each experimental condition for all activated regions found in the group analysis (Table II). The BOLD signal was extracted from a sphere (10‐mm diameter) around the peak activation in each region for the contrast DRAIN 1–REST.
