
Figure 4.
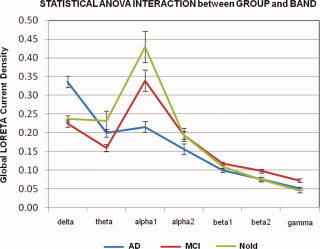
Grand average of Global low resolution brain electromagnetic tomography (LORETA) solutions (i.e., relative power current density averaged across all cortical voxels ± standard error, SE) modeling the distributed cortical EEG sources for delta, theta, alpha 1, alpha 2, beta 1, beta 2, and gamma bands in normal elderly (Nold), amnesic mild cognitive impairment (MCI), and Alzheimer's disease (AD) subjects. The LORETA values refer to an ANOVA interaction (F(12,1542) = 13.87; P < 0.00001) between the factors Group (Nold, MCI, AD) and Band (delta, theta, alpha 1, alpha 2, beta 1, beta 2, and gamma). [Color figure can be viewed in the online issue, which is available at wileyonlinelibrary.com.]