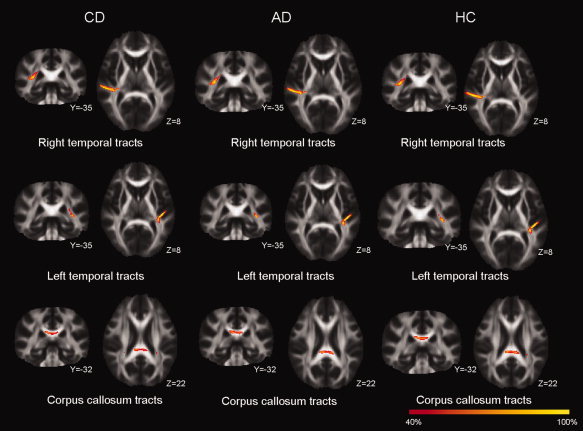
Figure 6.

Tractography distributions in congentially deaf (CD), acquired deaf (AD), and hearing controls (HC). The results were very similar for these three groups for right superior temporal gyrus (STG, top row), left Heschl's gyrus (HG, middle row), and splenium of corpus callosum (SCC, bottom row). The color bar represents the percent of participants having positive results from fiber tracking for that voxel.
