
Figure 4.
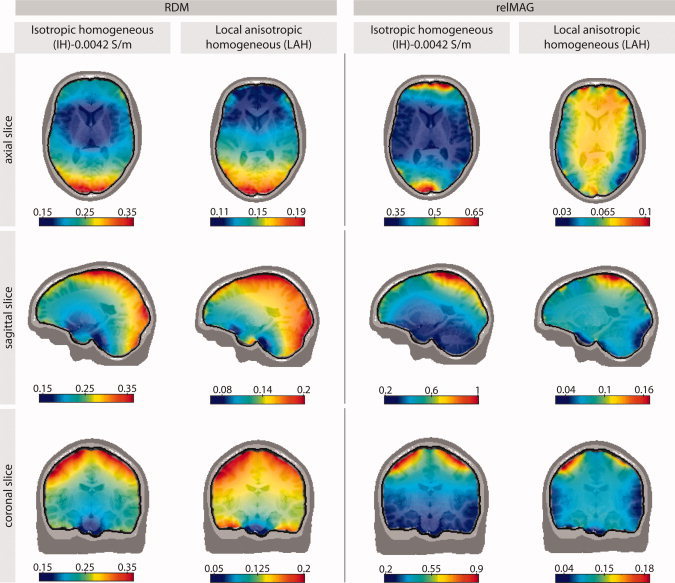
Spatial distribution of average (over all four subjects) forward modeling errors plotted on selected MRI slices of one subject (subject 1). Column 1 depicts the RDM errors of the IH model with the conventionally used skull conductivity value of 0.0042 S/m with respect to the IMC (reference) model. Column 2 shows the RDM error of the LAH model, which in general appeared to be the best approximation of the IMC model (see Fig. 2). Columns 3–4 show the relMAG error, respectively. [Color figure can be viewed in the online issue, which is available at wileyonlinelibrary.com.]