
Figure 6.
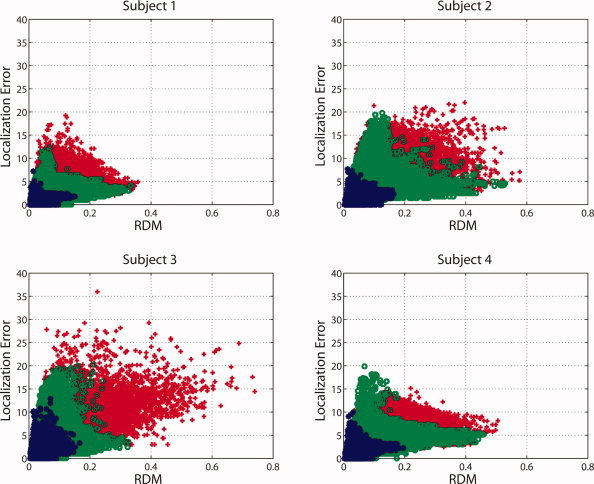
Forward topography error (RDM) and inverse (localization) error interaction depicted individually for each subject. The local models are depicted as blue dots. The optimized models and the standard model (IH, 0.0042 S/m) are shown as green circles and red crosses, respectively. [Color figure can be viewed in the online issue, which is available at wileyonlinelibrary.com.]