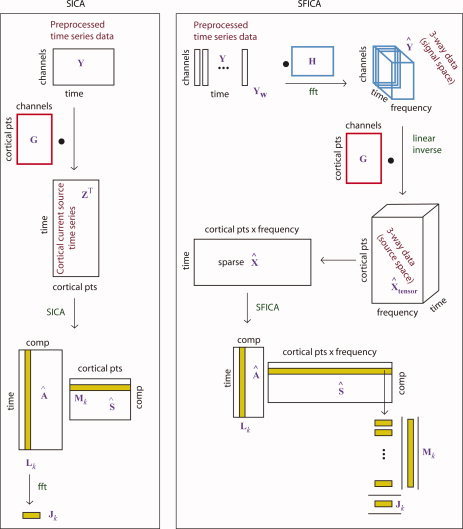
Figure 1.

Illustration of the various steps in the spatial ICA (SICA) algorithm (left) contrasted with the spatial Fourier‐ICA (SFICA) algorithm (right). Left, SICA: the preprocessed time‐series data (Y) were projected into cortical space by a left multiplication with a linear inverse operator (G) to obtain the cortical current time series Z. Real‐valued ICA was done on Z
T to obtain the spatial maps as the rows of S and the time courses as the columns of A. Right, SFICA: The preprocessed time‐series data (Y) was windowed (Y
w) and right‐multiplied by the FFT matrix to obtain channel‐wise short‐time Fourier transforms (
 ). The STFTs were left‐multiplied by the precomputed linear inverse operator (G) to obtain 3‐way data in cortical space (
 ). The complex valued
 was rearranged as time vs. cortical points x frequency (see text) and complex‐valued ICA was done on this matrix. The squared absolute values of the columns of A provide the envelopes of Fourier‐power and the rows of
 were decomposed into the spatial power map and power spectra (see text). [Color figure can be viewed in the online issue, which is available at wileyonlinelibrary.com.]
