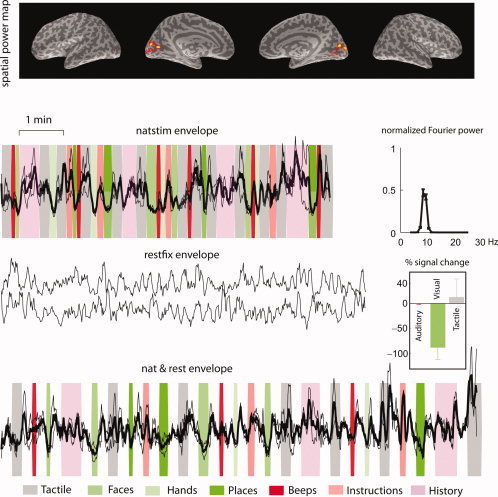
Figure 5.

A recovered source from real MEG data of a single subject using concatenated SFICA (out of 25 recovered sources). This component was found across subjects and is representative of the ∼10‐Hz parieto‐occipital alpha rhythm. The spatial power maps, thresholded to show the surface points with top 5% strength, are overlaid on the inflated brain surfaces of that subject (from left to right: left hemisphere lateral, left hemisphere medial, right hemisphere medial, and right hemisphere lateral views). The time courses show the z‐scores of the envelopes overlaid for the two runs each of natstim, restfix, and nat&rest. The dark line represents the mean across the two runs, and the lighter lines represent mean ± SEM. The background represents the stimulus sequence: green bands represent visual stimuli, red bands represent auditory stimuli, and gray bands represent tactile stimuli. The natstim and nat&rest conditions show a clear suppression to all three categories of visual stimuli (faces, hands and places). The component has relatively high scores of spatial sparseness, spectral sparseness and percent variance explained.
