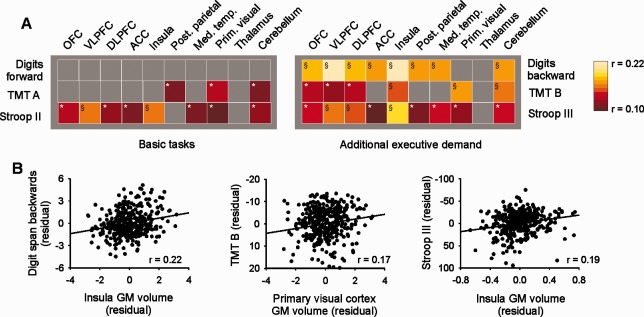
Figure 1.

Association of cognitive performance with regional gray matter volume. A: The association between mean gray matter volume within prespecified ROIs (ROI‐VBM analysis) and test scores was assessed by partial correlation (corrected for age and sex). Correlations are illustrated using color coding as indicated. *Significant at P < 0.05 (uncorrected); §significant at P < 0.05 after Bonferroni correction for 10 comparisons (corresponding to the number of ROIs tested). All correlations were positive, i.e., better performance was associated with larger gray matter volume. B: Partial correlation plots (after correction for age and gender) of digit span backward, TMT part B and Stroop test part III with the most strongly associated ROIs. GM, gray matter. [Color figure can be viewed in the online issue, which is available at http://wileyonlinelibrary.com.]
